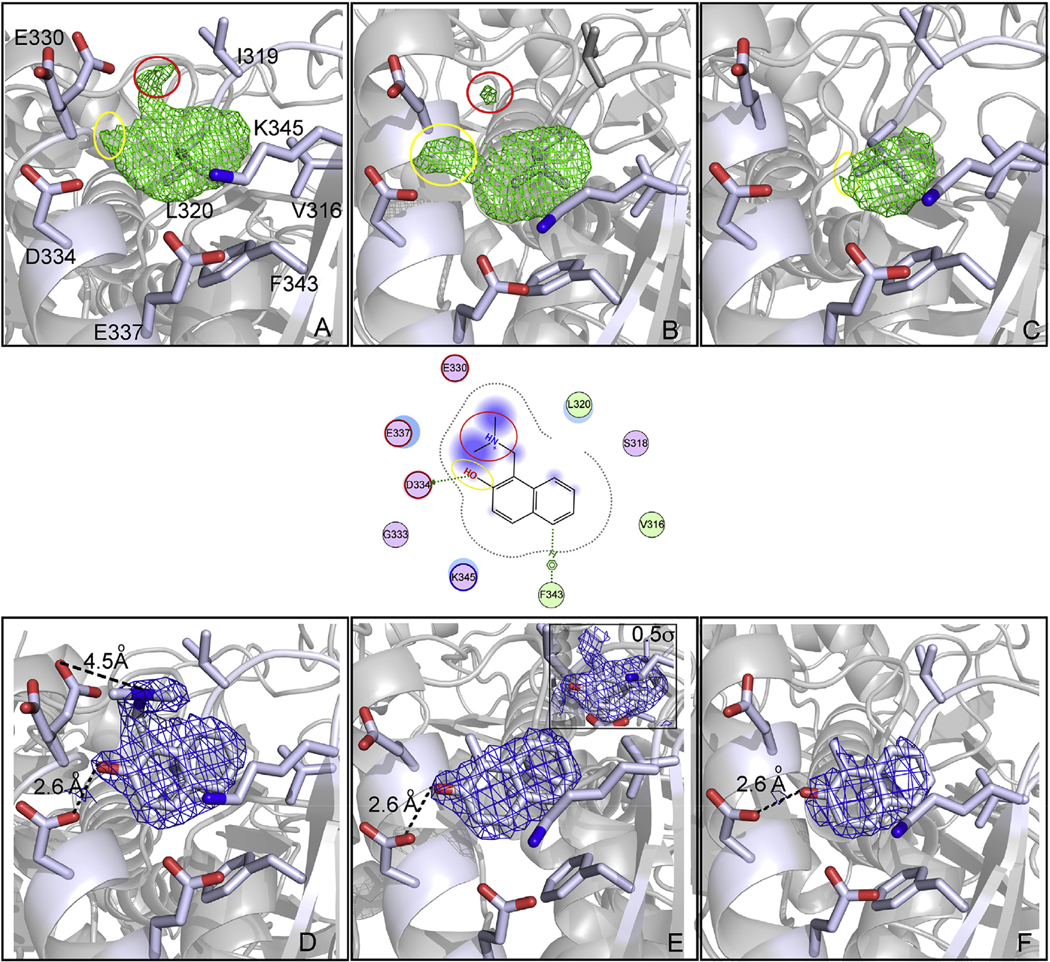
Fig. 3.

Snapshots of the transformation of 4 into a oQM in a secondary pocket of SmTGR. Panels represent the crystal structure of SmTGR in complex with 4 after 1 h soaking (A and D), 2 h soaking (B and E) and 4 h soaking (C and F). Polar interactions and H-bonds are displayed as dotted-lines. A two-dimensional depiction of the environment of the ligand is shown in the middle of the figure. The green electron density maps represent the Fo − Fc omit map contoured at 3σ and the blue electron density maps represent the 2Fo − Fc omit map contoured at 1σ, unless where it is differently indicated. At 1 h the electron densities are doubled branched indicating the prominent presence of the intact 4; after 2 h the density is flat, except for a small positive electron density spot localized in the same position of the dimethylamino group of 4 at 1 h. In the insert of Panel E, the 2Fo-Fc electron density, contoured at 0.5σ, indicates that few molecules of 4 are still not transformed in the crystal lattice. After 4 h, the density is completely flat without any branched portion that protrudes out of the aryl plane, indicating completion of the reaction. (For interpretation of the references to color in this figure legend, the reader is referred to the Web version of this article.)
