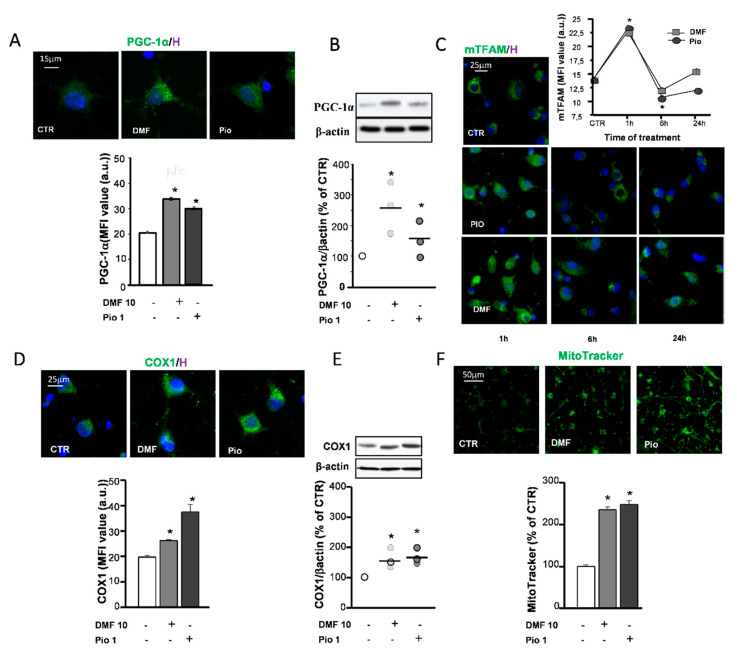
Figure 3.
DMF and pio induce mitochondrial biogenesis. OP cultures treated for 24 h with 10-µM DMF or 1-µM pio were processed for IF experiments with PPAR-γ coactivator-1α (PGC-1α) (A). The micrographs show PGC-1α (green) and Hoechst 33258 nuclear fluorochrome (blue, H). The bar graph shows MFI analysis (MFI ± SEM from n = 250–300; * p < 0.05 vs. CTR). WB analysis of PGC-1α expression is shown (B). Representative bands of β-actin and PGC-1α are shown above; densitometric analysis is shown as mean and individual data points in the graph below (n = 3; *p < 0.05 vs. CTR). OP cultures treated for different time points (1, 6, and 24 h) with 10-µM DMF or 1-µM pio were immunostained for transcription factor A (TFAM) (C). The micrographs show TFAM (green) and Hoechst 33258 (blue, H). The graph shows the MFI analysis (n = 250–300 cells; * p < 0.005 vs. CTR). OP cultures treated with 10-µM DMF or 1-µM pio were processed for IF experiments with complex IV core protein (COX-1) (D). The micrographs show COX-1 (green) and Hoechst 33258 (blue, H). The bar graph shows the MFI analysis (n = 250–300 cells; * p <0.05 vs. CTR). WB analysis of COX-1 expression is shown (E). Representative bands of β-actin and PGC-1α are shown above; densitometric analysis is shown as mean and individual data points in the graph below (n = 3; * p < 0.05 vs. CTR). OP cultures were treated with 10-µM DMF or 1-µM pio and then loaded with the mitochondrial probe MitoTracker Green (F). MitoTracker fluorescence intensities were measured from single cells, and mean ± SEM are shown in the bar graph. CTR is taken as 100% (n = 308–460 cells; * p < 0.05 vs. CTR).

