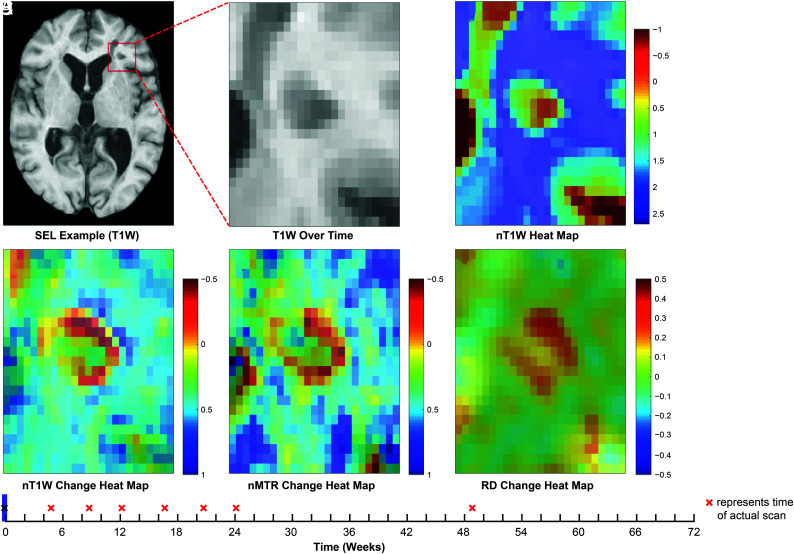
FIG 4.
Example of lesion-level distribution of longitudinal tissue damage within SELs. Heat maps for normalized T1WI intensity and normalized T1WI (nTIWI), nMTR, and DTI-RD intensity change are based on linear modeling of intensity with time. Red “×” labels represent time of brain MR imaging scanning acquisitions. See On-line video for an animated version of this figure.

