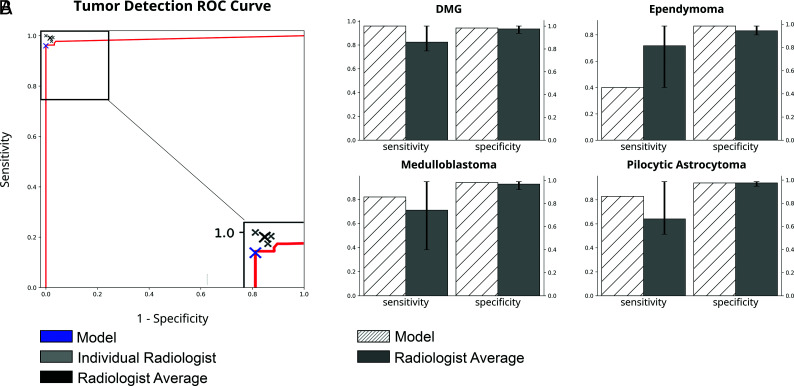
FIG 1.
Comparison of model-with-radiologist performance. A, ROC curve for scan-level tumor detection. Model, individual radiologist, and average radiologist performance are indicated with crosshairs. B, Model and average radiologist performance for tumor subtype classification results. Error bars represent standard error among radiologists.

