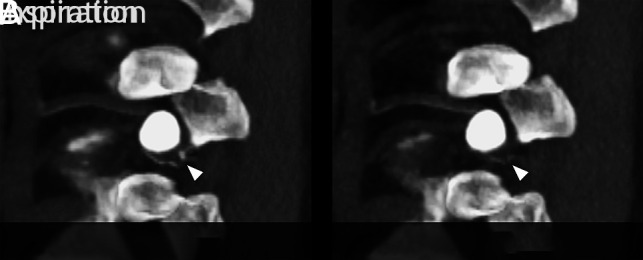
FIG 3.

Parasagittal maximum-intensity-projection CT myelograms through the neuroforamen of a left T10 CSF–venous fistula. A, Image acquired during inspiration clearly captures contrast within the CSF–venous fistula (arrowhead). B, Image acquired during expiration. Note the markedly reduced conspicuity of the CSF–venous fistula (arrowhead).
