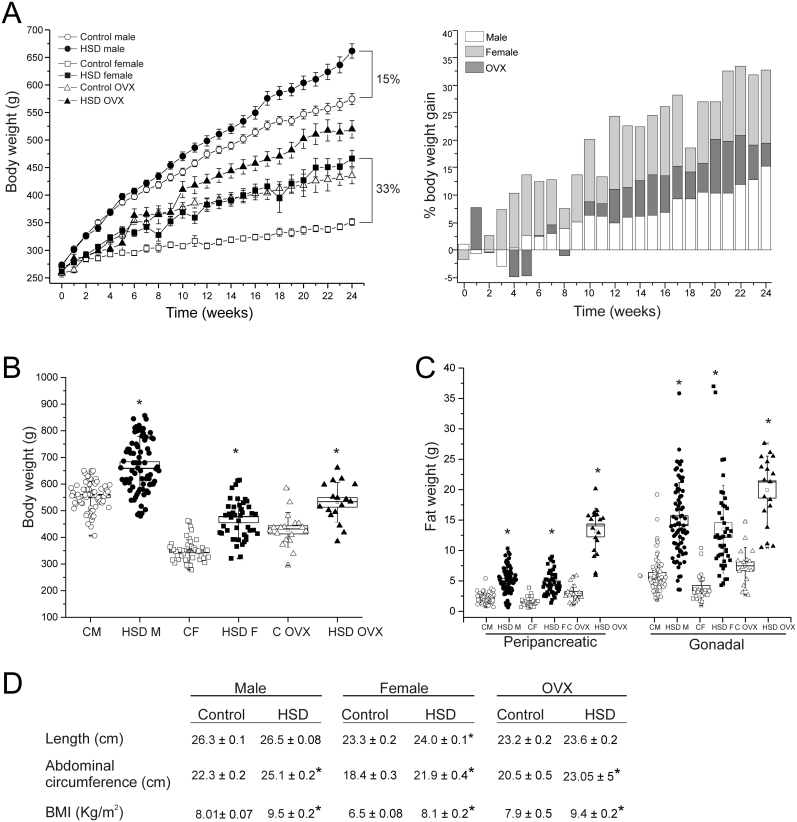
Figure 1.
High-sucrose diet produces obesity. (A) Body weight gain after 24 weeks of diet (left panel) and the percentage of BW gain compared to control (right panel) in control and HSD male (n = 65, for control and HSD groups), female (n = 24, for control and HSD groups) and ovariectomized rats (OVX; n = 12, for control and HSD groups). (B) Body weight at the end of HSD treatment mean ± s.e.m. Two-way ANOVA was performed (Sex, F(1,228) = 380.9, and diet, F(1,228) = 122.6, P = 0.0001 for both factors), with post hoc Tukey’s test, *P < 0.0001 compared to their control groups, #P < 0.0001 compared to control male group, boxes around the mean represent the s.e.m., and whiskers represent the s.d. (C) Peripancreatic and gonadal adipose tissue weight of males (n = 63 to control and n = 75 to HSD), females (n = 29 and 44 for control and HSD respectively) and OVXs (n = 18 for both conditions), boxes around the mean represent the s.e.m., and whiskers represent the s.d. Two-way ANOVA was performed (Sex, F(1,208) = 3.8 and F(1,207) = 5.5; P = 5.2 x 10⁻² and P = 0.019 for pWAT and gWAT respectively; Diet, F(1,208) = 158.9 and F(1,207) = 143.3; P = 0.0001 for pWAT and gWAT respectively), with post hoc Tukey’s test, *P < 0.0001 compared to their control group. (D) Somatometric parameters mean ± s.e.m. for length, abdominal circumference (AC) and BMI. Two-way ANOVA was performed (Sex, F(1,225) = 595.9, 207.5 and 106.7; P = 0.0001 for length, AC and BMI, respectively) with post hoc Tukey’s test. *P < 0.0001 compared to their control groups.

 This work is licensed under a