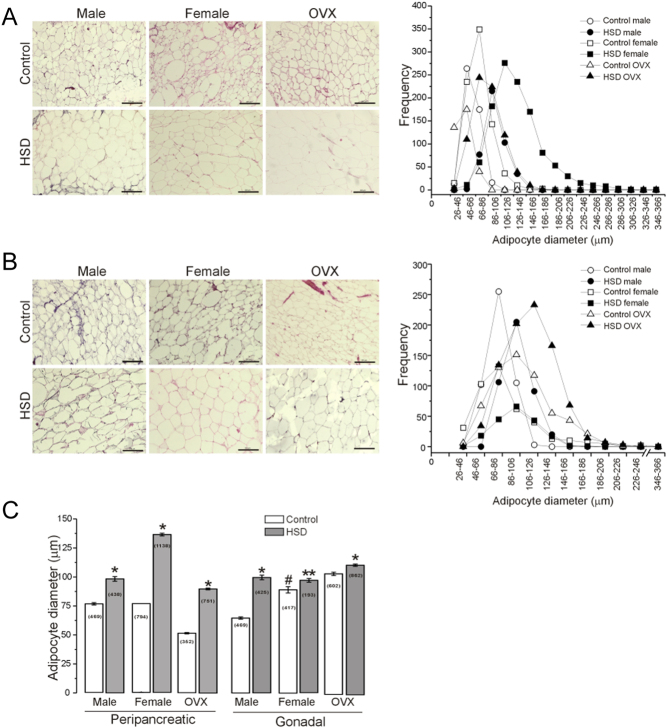
Figure 4.
High-sucrose diet produces hypertrophy of the peripancreatic and gonadal adipocytes. Representative picture of H&E stained sections (n = 6 animals per group and 10 optic fields per animal) from peripancreatic (A), and gonadal adipose tissue (B), the insert represent the frequency histogram of adipocyte diameters (classified in 17 classes from 26–46 µm to 346–366 µm). (C) The bars represent the mean ± s.e.m. of adipocytes diameter for both adipose tissue depots from male, female and OVX rats of both conditions (n is indicated in the bars). Two-way ANOVA was performed (Sex, F(1,2835) = 409.3 and F(1,1500) = 10.3; P = 0 and P = 0.0013 for pWAT and gWAT respectively; Diet, F(1,2835)= 1714.6 and F(1,1500) = 69.0; P = 0 and P = 2.2 x 10⁻¹⁶ for pWAT and gWAT respectively), with post hoc Tukey’s test; with interaction between sex and diet. *P < 0.0001, **P < 0.03 compared to the control group, #P < 0.0001 compared to the control male group. 10x objective, scale bar = 200 µm.

 This work is licensed under a