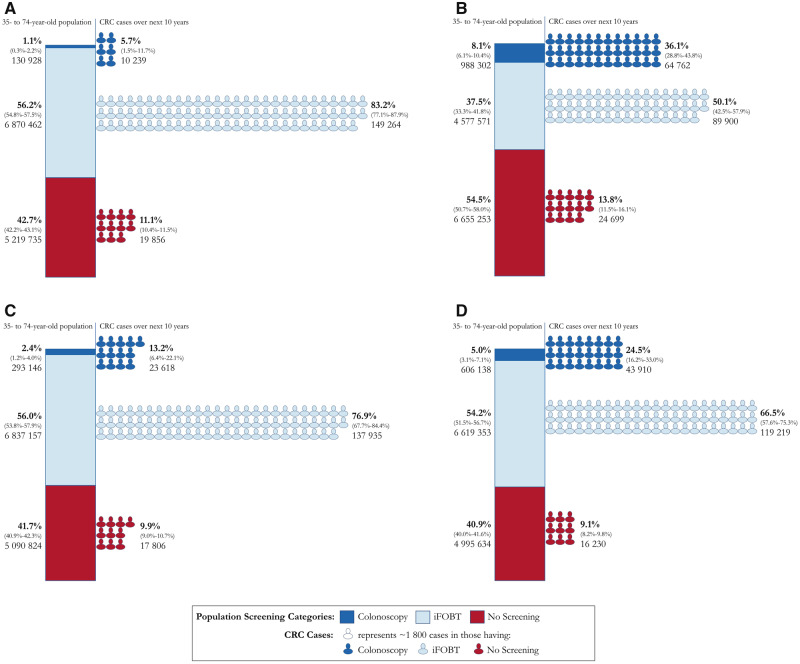
Figure 2.
Proportions and number of colorectal cancer (CRC) screens and predicted CRC in each screening group in 35- to 74-year-old Australians. The first column (bar chart) in each panel represents the proportion (95% confidence intervals of proportions, absolute number) of 35- to 74-year-old Australians who would not be screened for CRC, be screened with immunochemical fecal occult blood testing (iFOBT), and be screened with colonoscopy under each scenario. The second column (person icons) represents the proportion (95% confidence intervals of proportions, absolute number) of predicted CRC in the next 10 years that would occur in each of the screened groups. All scenarios (except scenario 1) use a combined lifestyle and genomic risk prediction model to place individuals in each screening group. A) Scenario 1, the current Australian guidelines. B) Scenario 2, a program based on absolute risk thresholds for screening using the risk prediction model. C) Scenario 3, a category-based program (3 categories not accounting for sex) using the risk prediction model. D) Scenario 4, a category-based program (4 categories accounting for sex) using the risk prediction model program. Some percentages do not sum to 100% due to rounding. The 95% confidence intervals for absolute numbers can be found in Supplementary Table 4 (available online).

