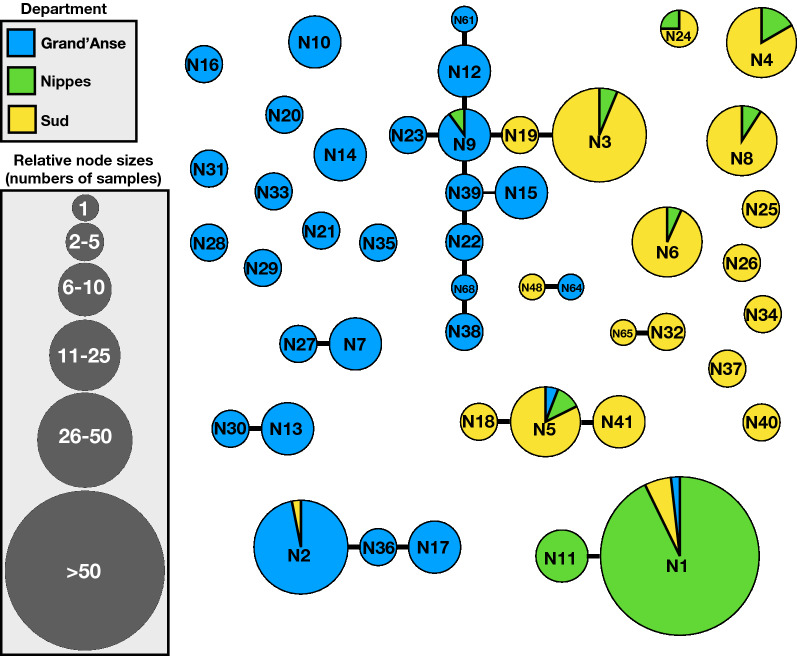
Fig. 5.
Graph analysis of all 462 samples with complete 21-SNP barcodes. The barcode-identical samples are grouped into nodes (circles) connected by edges (lines) only to nodes with which they share 20 of the 21 barcode sites. Among the 41 barcode-identical nodes (sized relative to the number of samples sharing the same barcode), 28 were highly related to another barcode-identical node (sharing 20 of the 21 barcode SNPs). Only 25 samples (6%) are not included among the identical and highly-related nodes. The ‘N’ numbers correspond to the node numbers indicated in Additional file 1: Table S1

