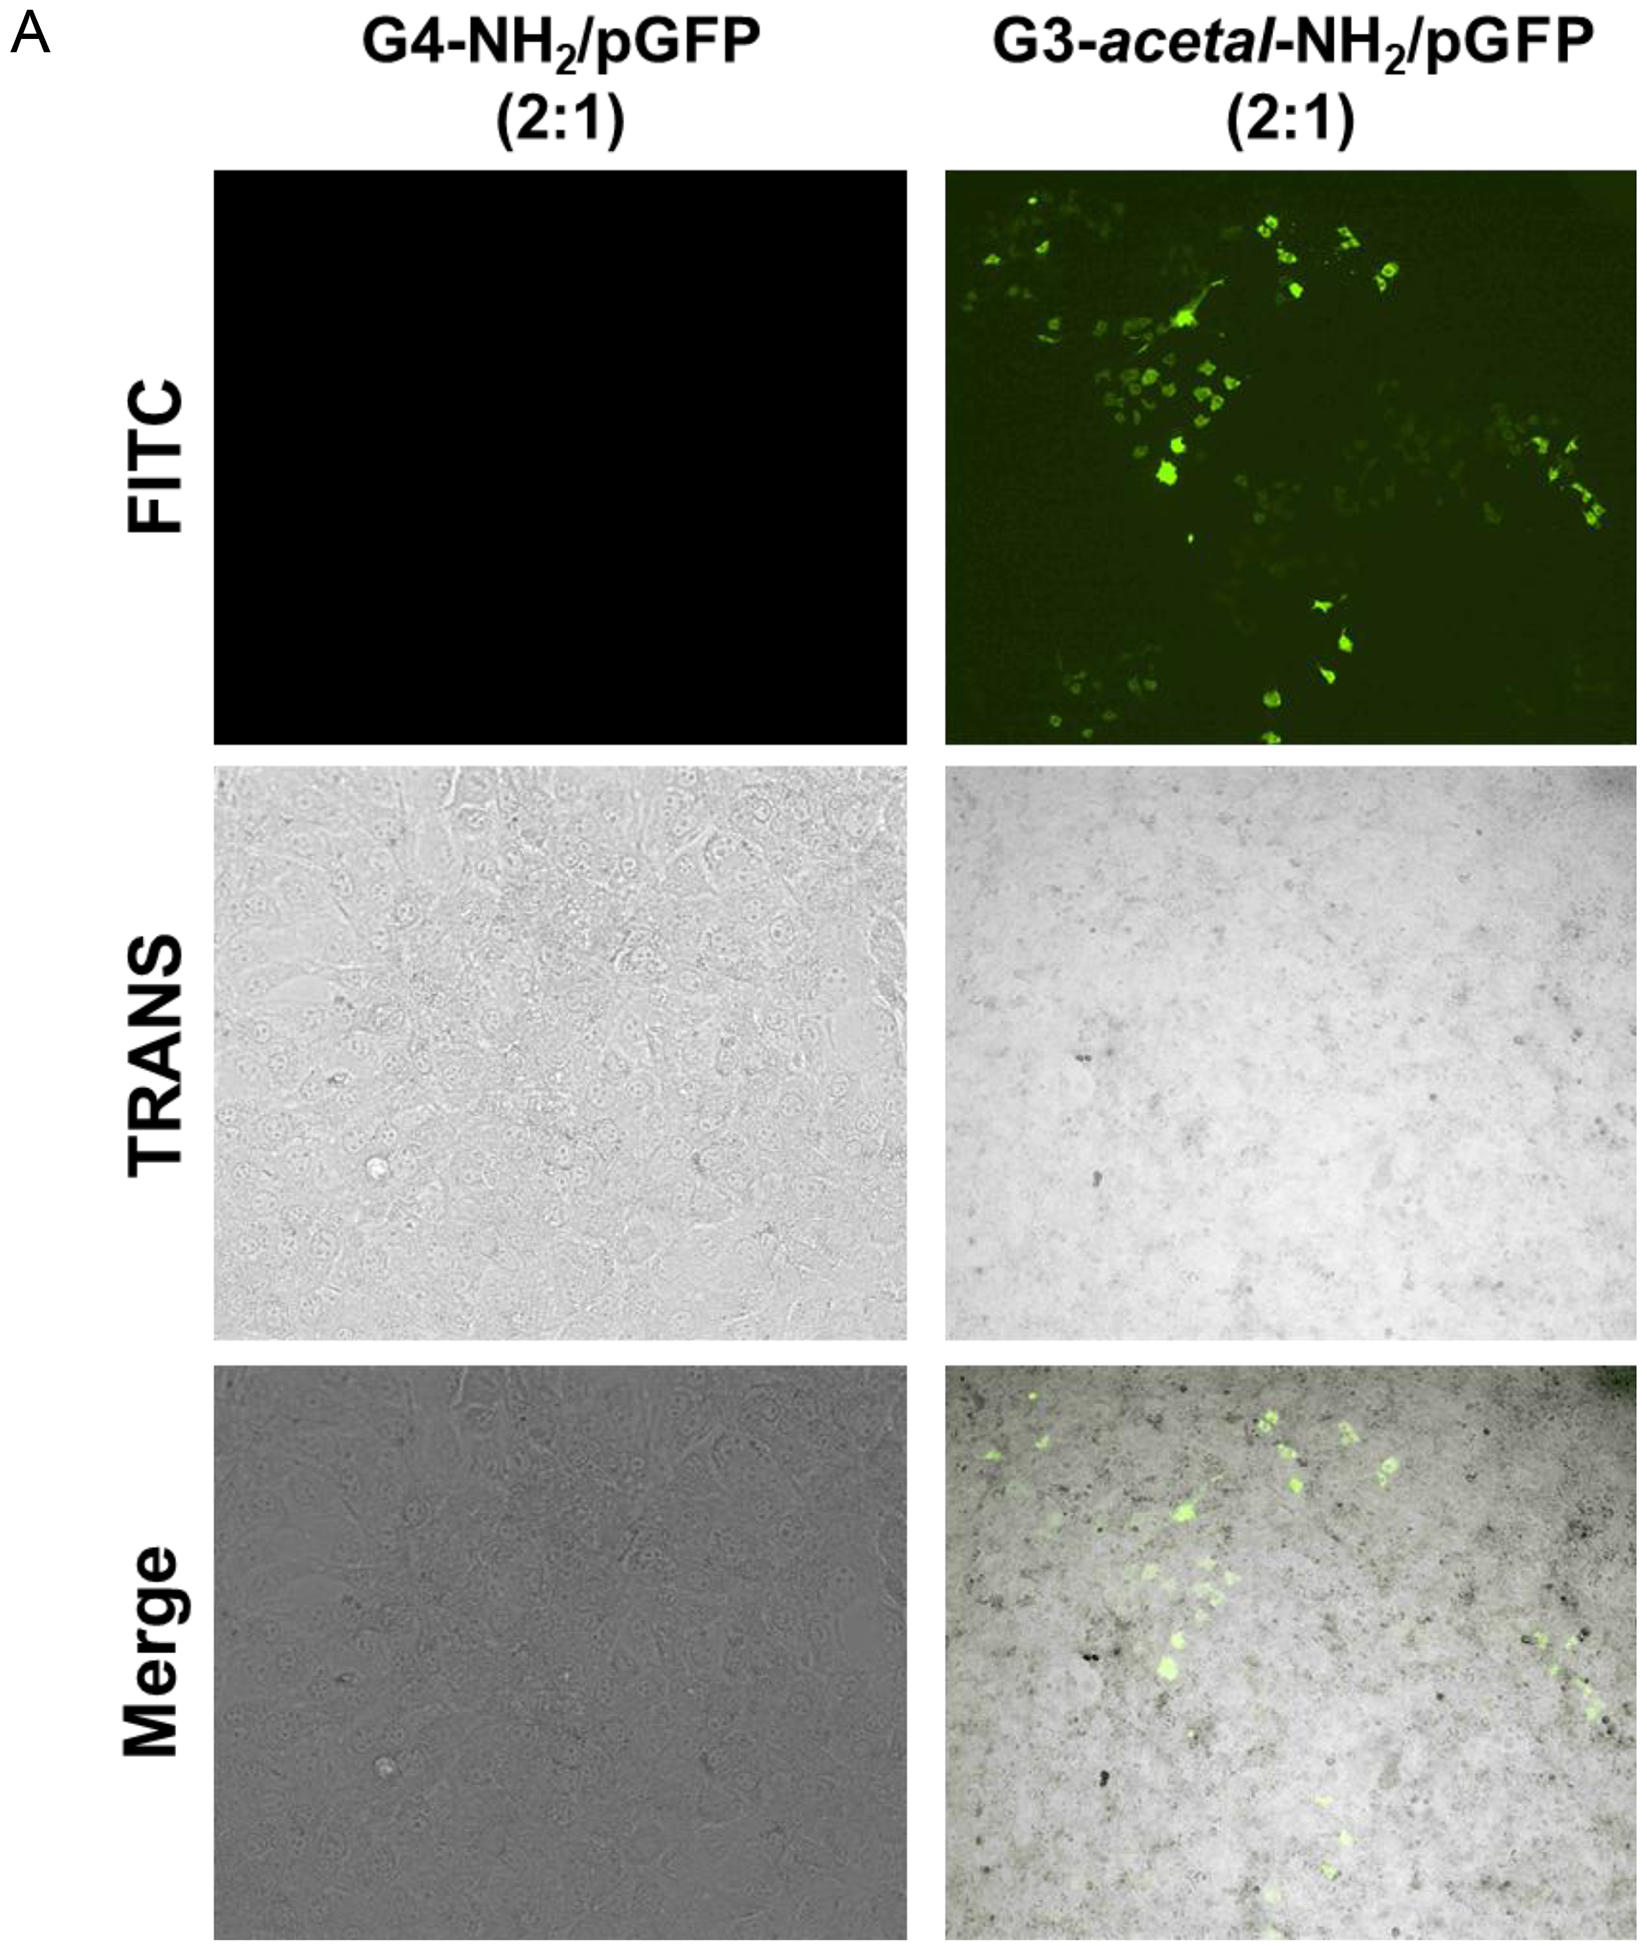
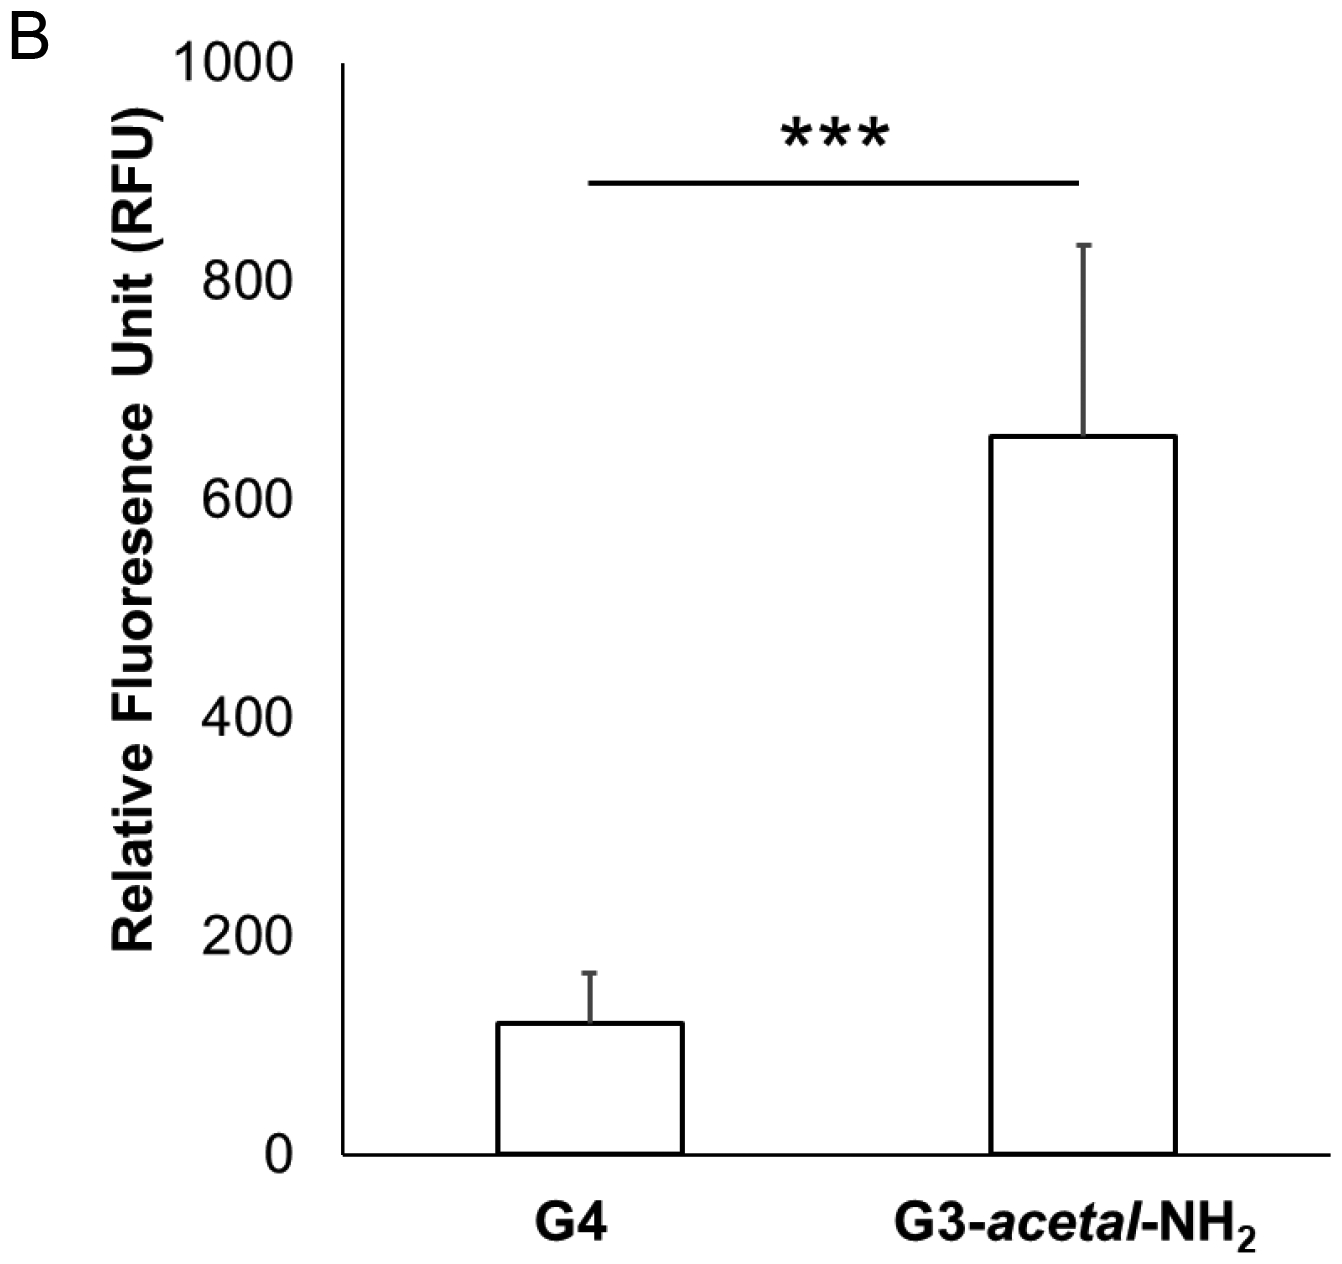
Figure 9.


(A) Fluorescence images (4×) of NIH3T3 cells treated with G4-NH2/pGFP or G3-acetal-NH2/pGFP. No transfected cells were detected in the G4-NH2/pGFP group at the 2:1 ratio. (B) Relative fluorescence of extracted protein from cell lysate. The cells treated with G4-NH2/pGFP and G3-acetal-NH2/pGFP were lysed, and whole protein quantified relative to untreated NIH3T3 cells. Proteins expressing GFP were detected using a NanoDrop3300 fluorospectrometer. ***, p < 0.001.
