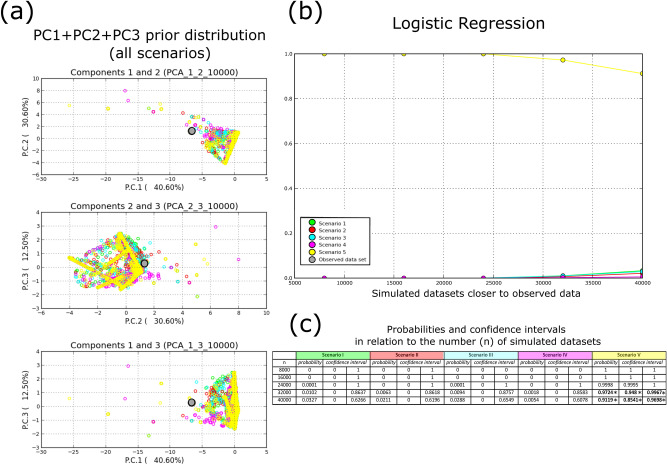
Figure 2.
Results of hypothesis-testing generated scenarios with Approximate Bayesian Computation. In (a), prior distributions of simulated datasets for all the 5 scenarios in relation to the observed dataset (figure produced by the software). In (b), is shown the multinomial logistic regression used to infer the best-fit model considering a gradual increase of simulated datasets, n, ranked by proximity to the observed dataset. Specifically, the x-axis denotes the number of simulated datasets closer to the observed dataset, n = {8000, 16,000, 24,000, 32,000, 40,000}; the y-axis shows the logit regression R2 as a function of n. In (c) is given the evolution of R2 ´s confidence intervals for the n in (b). The * denotes non-overlapping confidence intervals among scenarios for the same n. The figure was partially produced with DIYABC v2.1.0.

