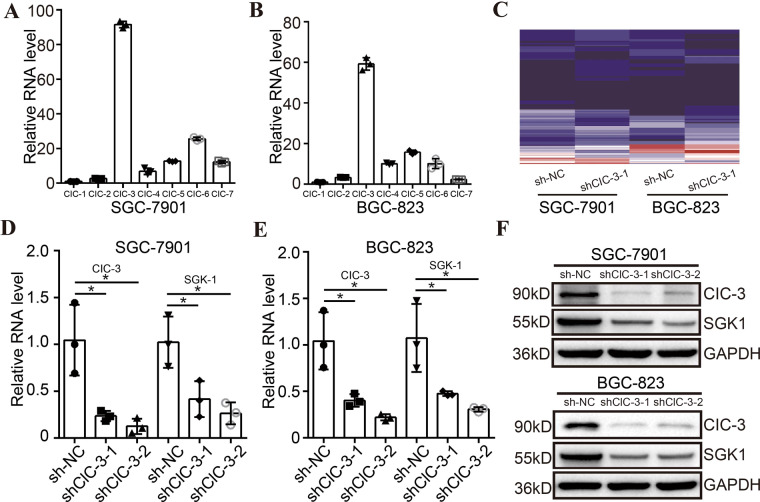
Fig. 2. ClC-3/SGK1 regulatory axis was identified and validated in STAD cell lines.
A, B The RNA level of ClC-3 was significantly abundant compared with other ClC chloride channel superfamily members (n = 3). C The heatmap of RNA sequencing revealed that 60 same genes were correspondingly down-regulated in the two ClC-3 KD cells, of which the SGK1 gene was the mostly down-regulated. D, E The RNA levels of ClC-3 and SGK1 were significantly reduced in the two ClC-3 KD cells (n = 3). F The protein levels of ClC-3 and SGK1 were significantly decreased in the two ClC-3 KD cells (n = 3). shNC negative control shRNA, shClC-3-1 ClC-3 knockdown shRNA-1, shClC-3-2 ClC-3 knockdown shRNA-2. *P < 0.05.

