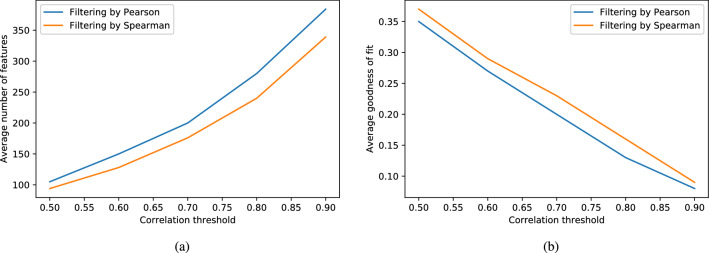
Figure 4.
Exploring the effect of changing the similarity threshold: (a) the average number of retained features is shown as an increasing function in similarity threshold; and, (b) the average goodness-of-fit between the 50 PCs of both the original and reduced features is shown as a decreasing function in similarity threshold. This figure has been created using the Python library Matplotlib (version 3.3.0), available at https://matplotlib.org/users/installing.html.

