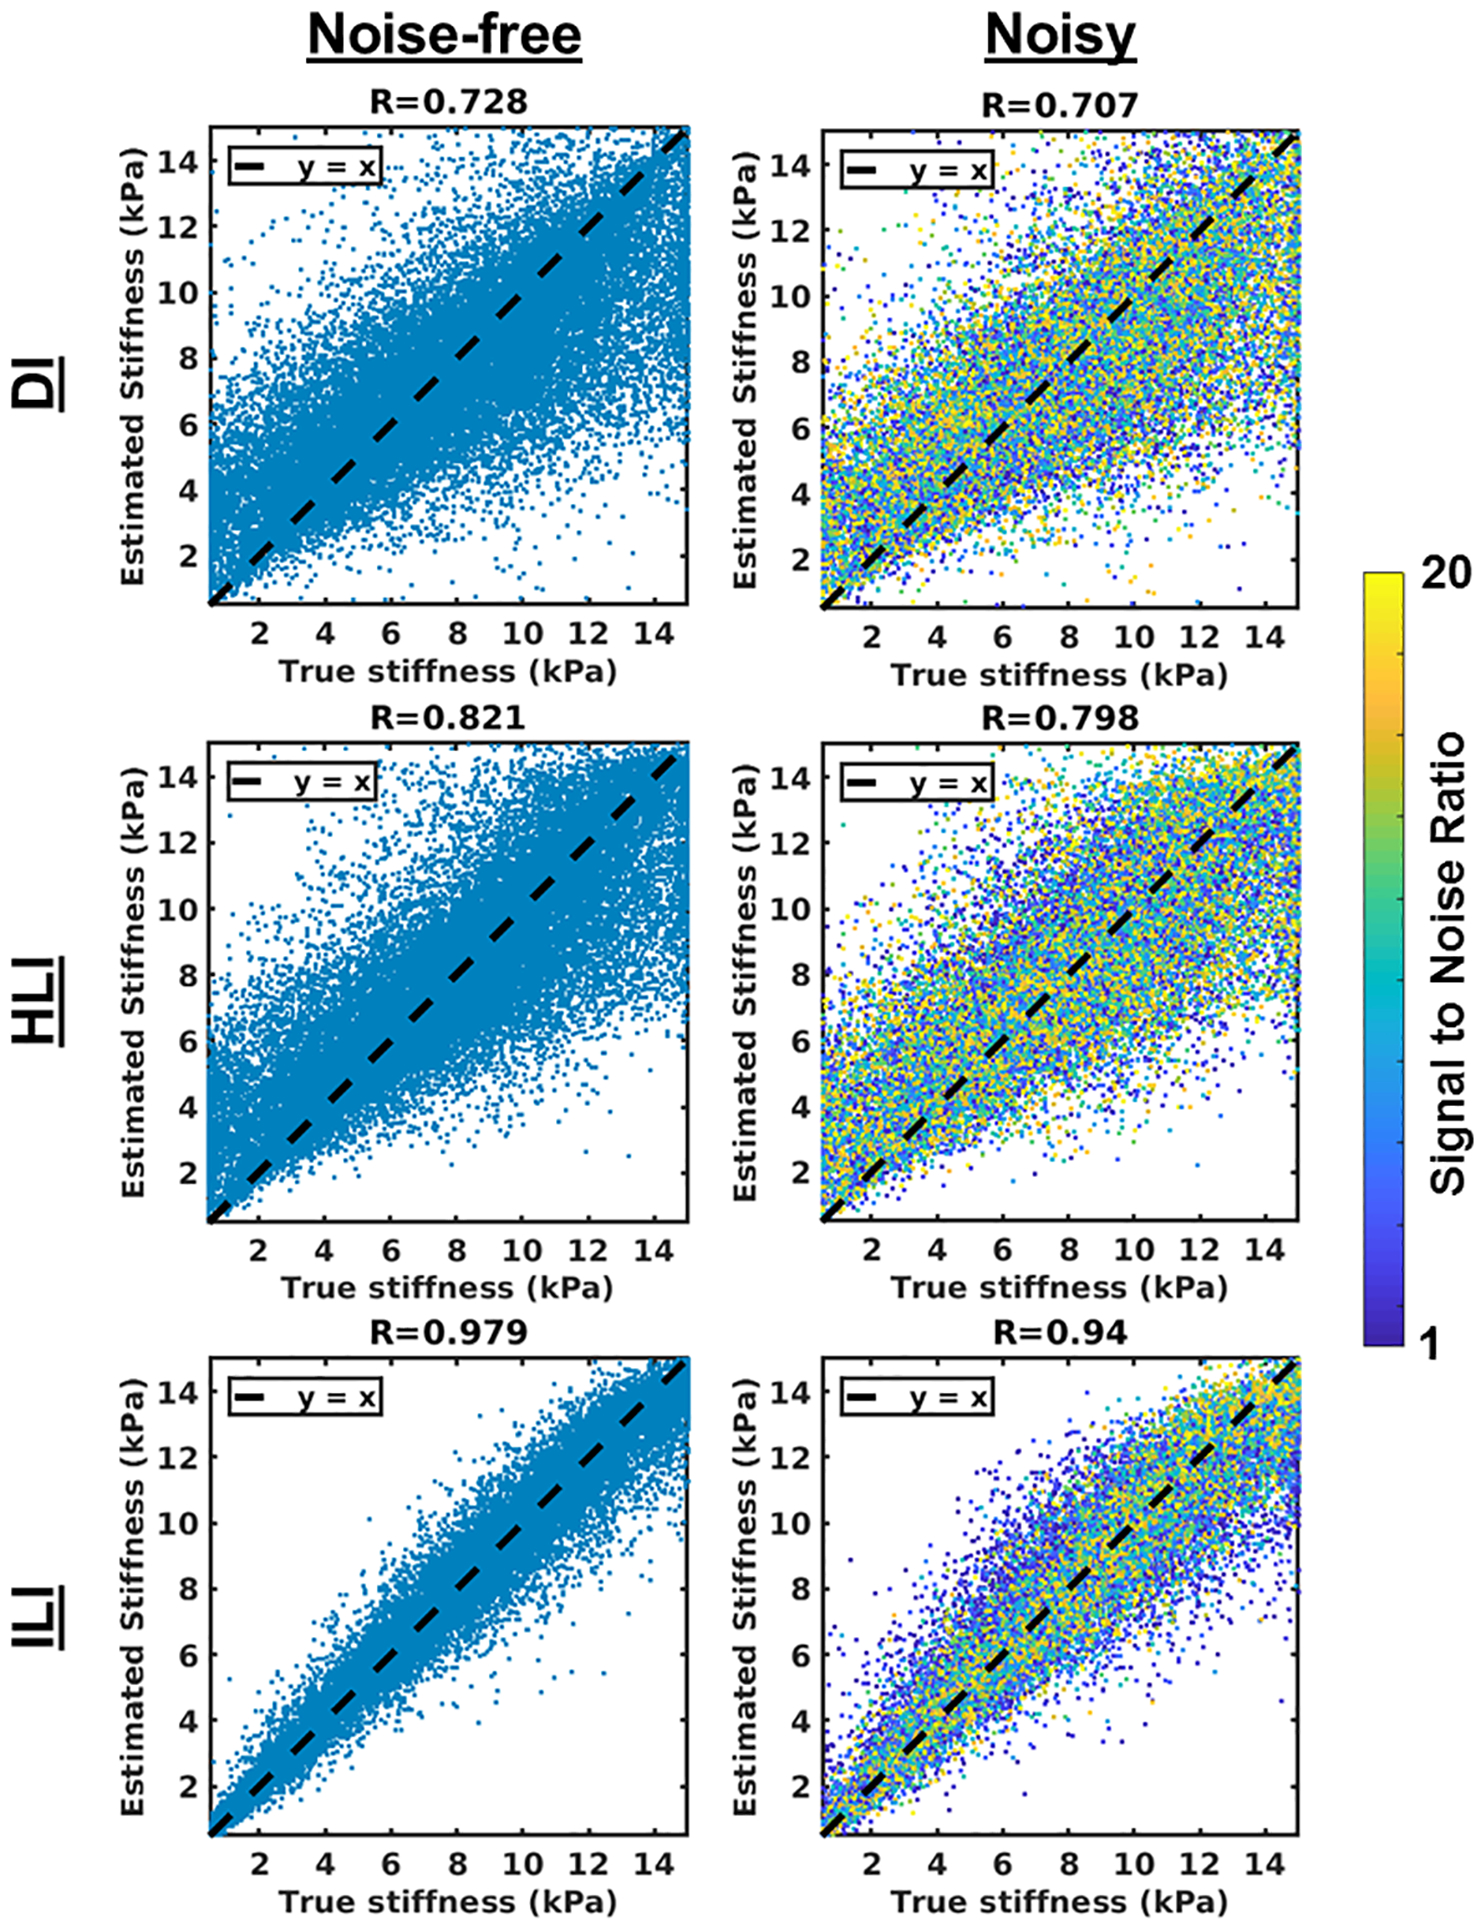
Figure 2. ILI is more accurate than HLI and DI in its test set.

DI, top row, HLI, middle row, and ILI, bottom row, results in a test set of 30,000 patches. Results for noise-free patches (first column) and noise added patches (second column) are shown. The spatial footprint that maximized the correlation coefficient in the noisy case is shown for each inversion (11×11×11 for DI, 9×9×9 for HLI, and 9×9×9 for ILI).
