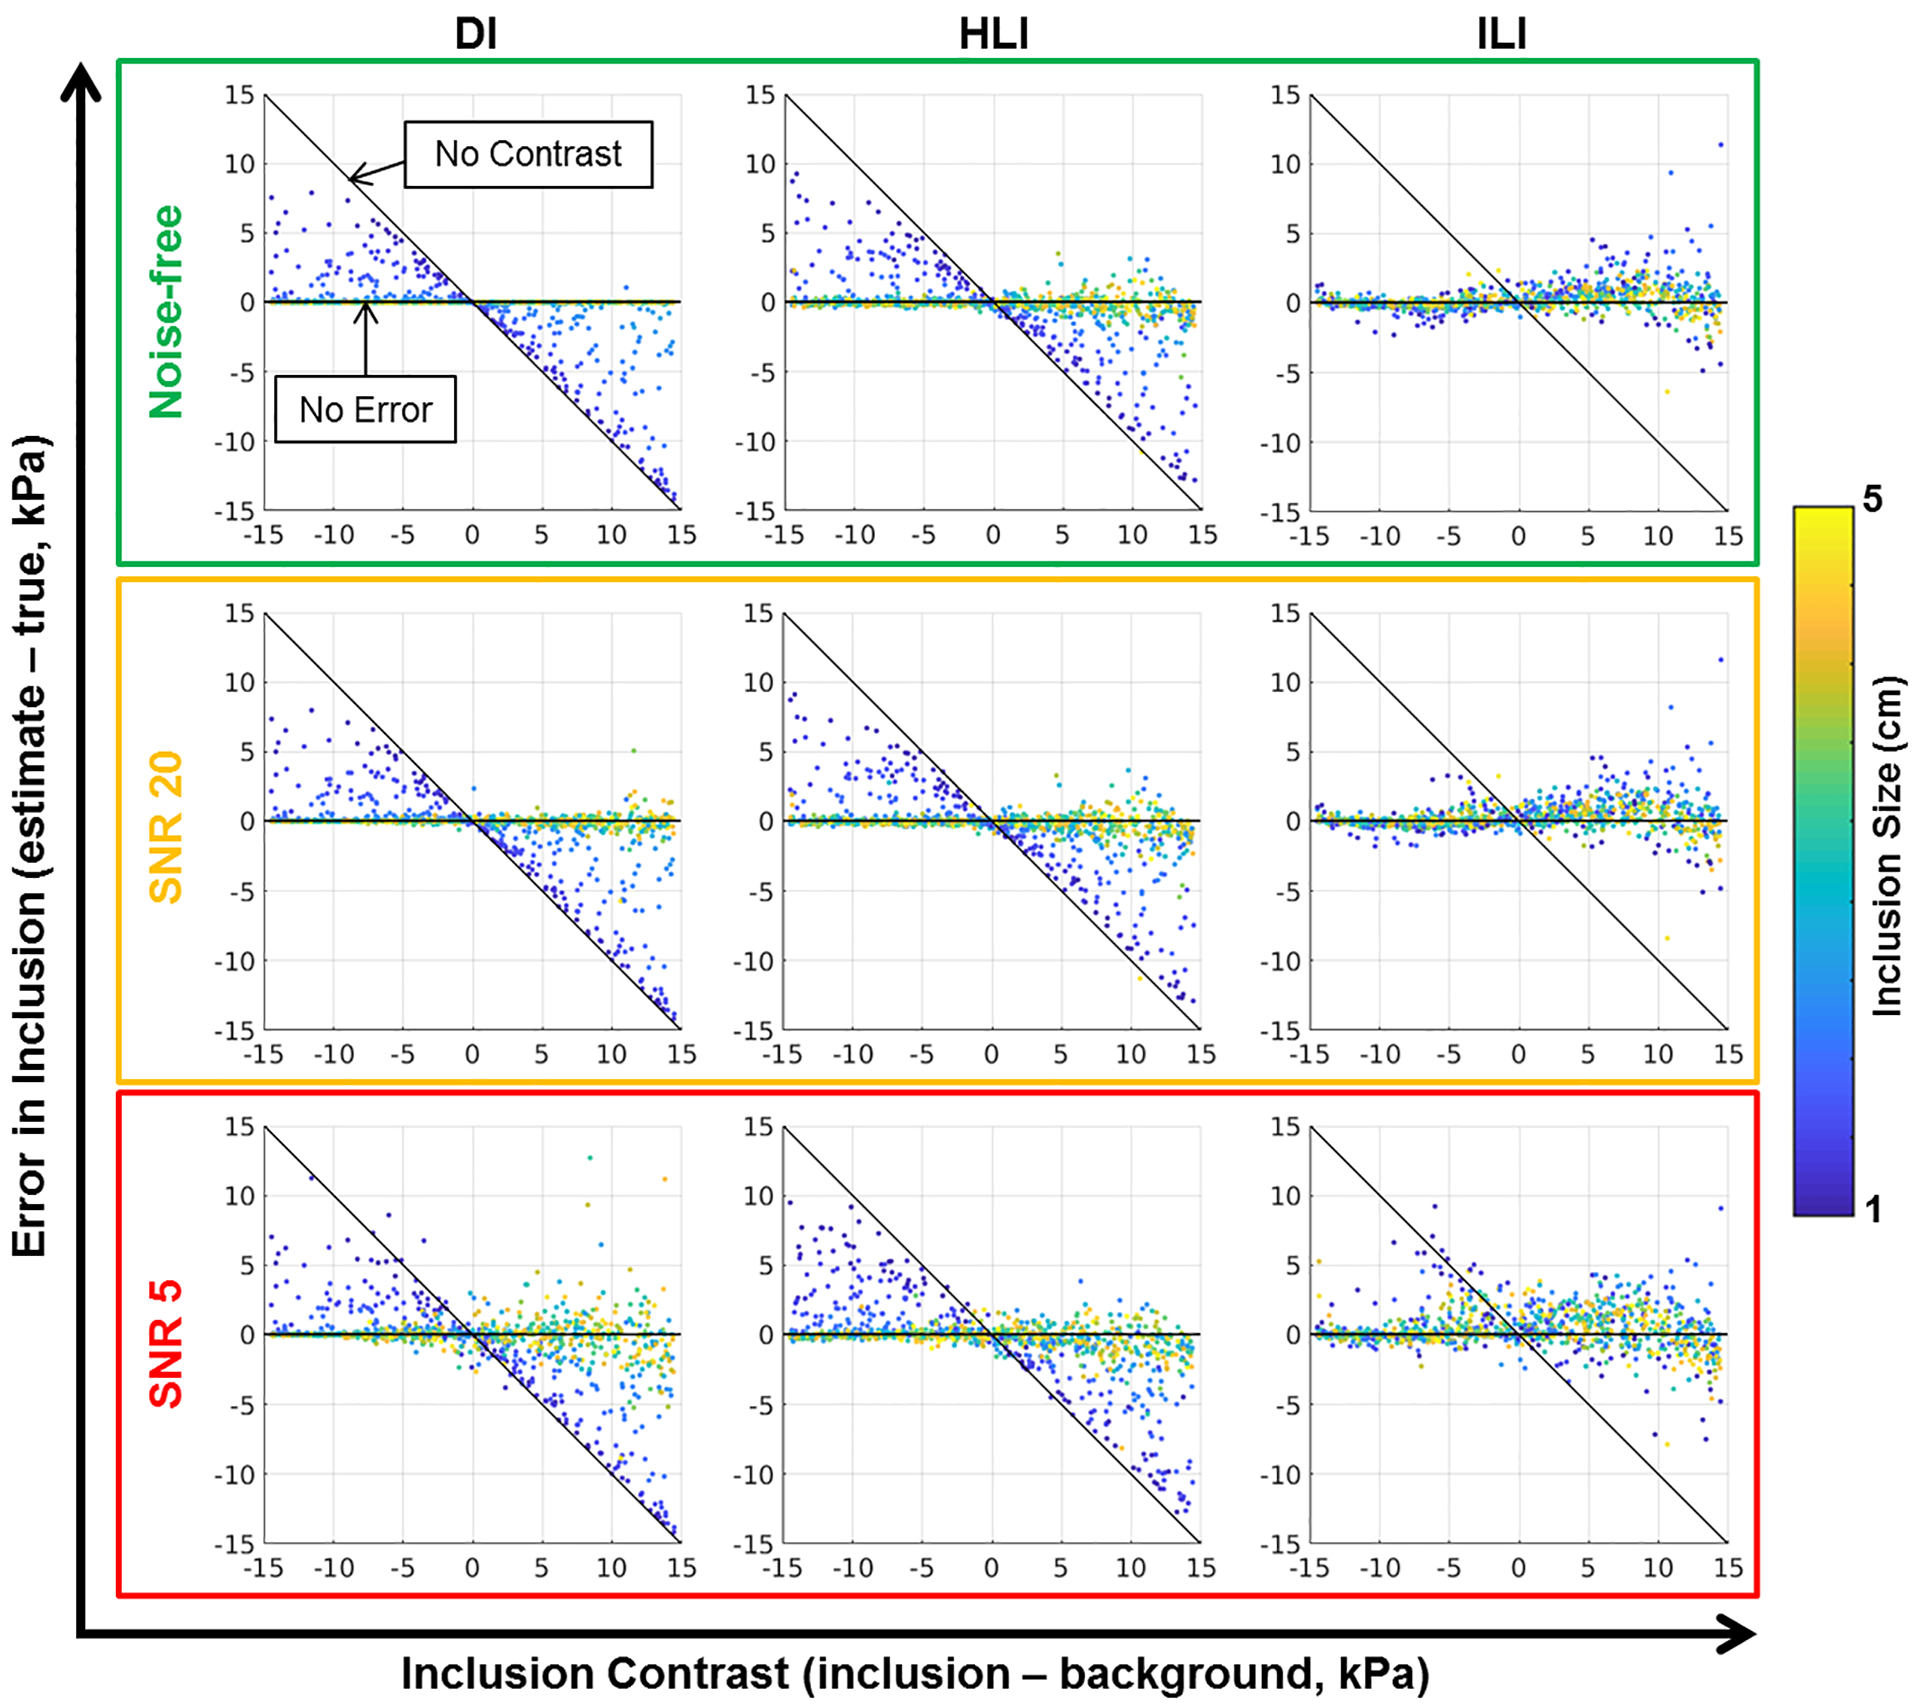
Figure 3. Summary results from Coupled Harmonic Oscillators (CHO) experiment.

Each plot shows the error in inclusion estimate (estimated stiffness in the inclusion - true stiffness in inclusion) vs the inclusion contrast (true inclusion stiffness - true background stiffness) in 1000 CHO simulations. For a perfect inversion all points would be along the zero-error line. If an inversion completely fails to detect the inclusion points will be along the diagonal labeled “No Contrast”. The color of the data points corresponds to inclusion size.
