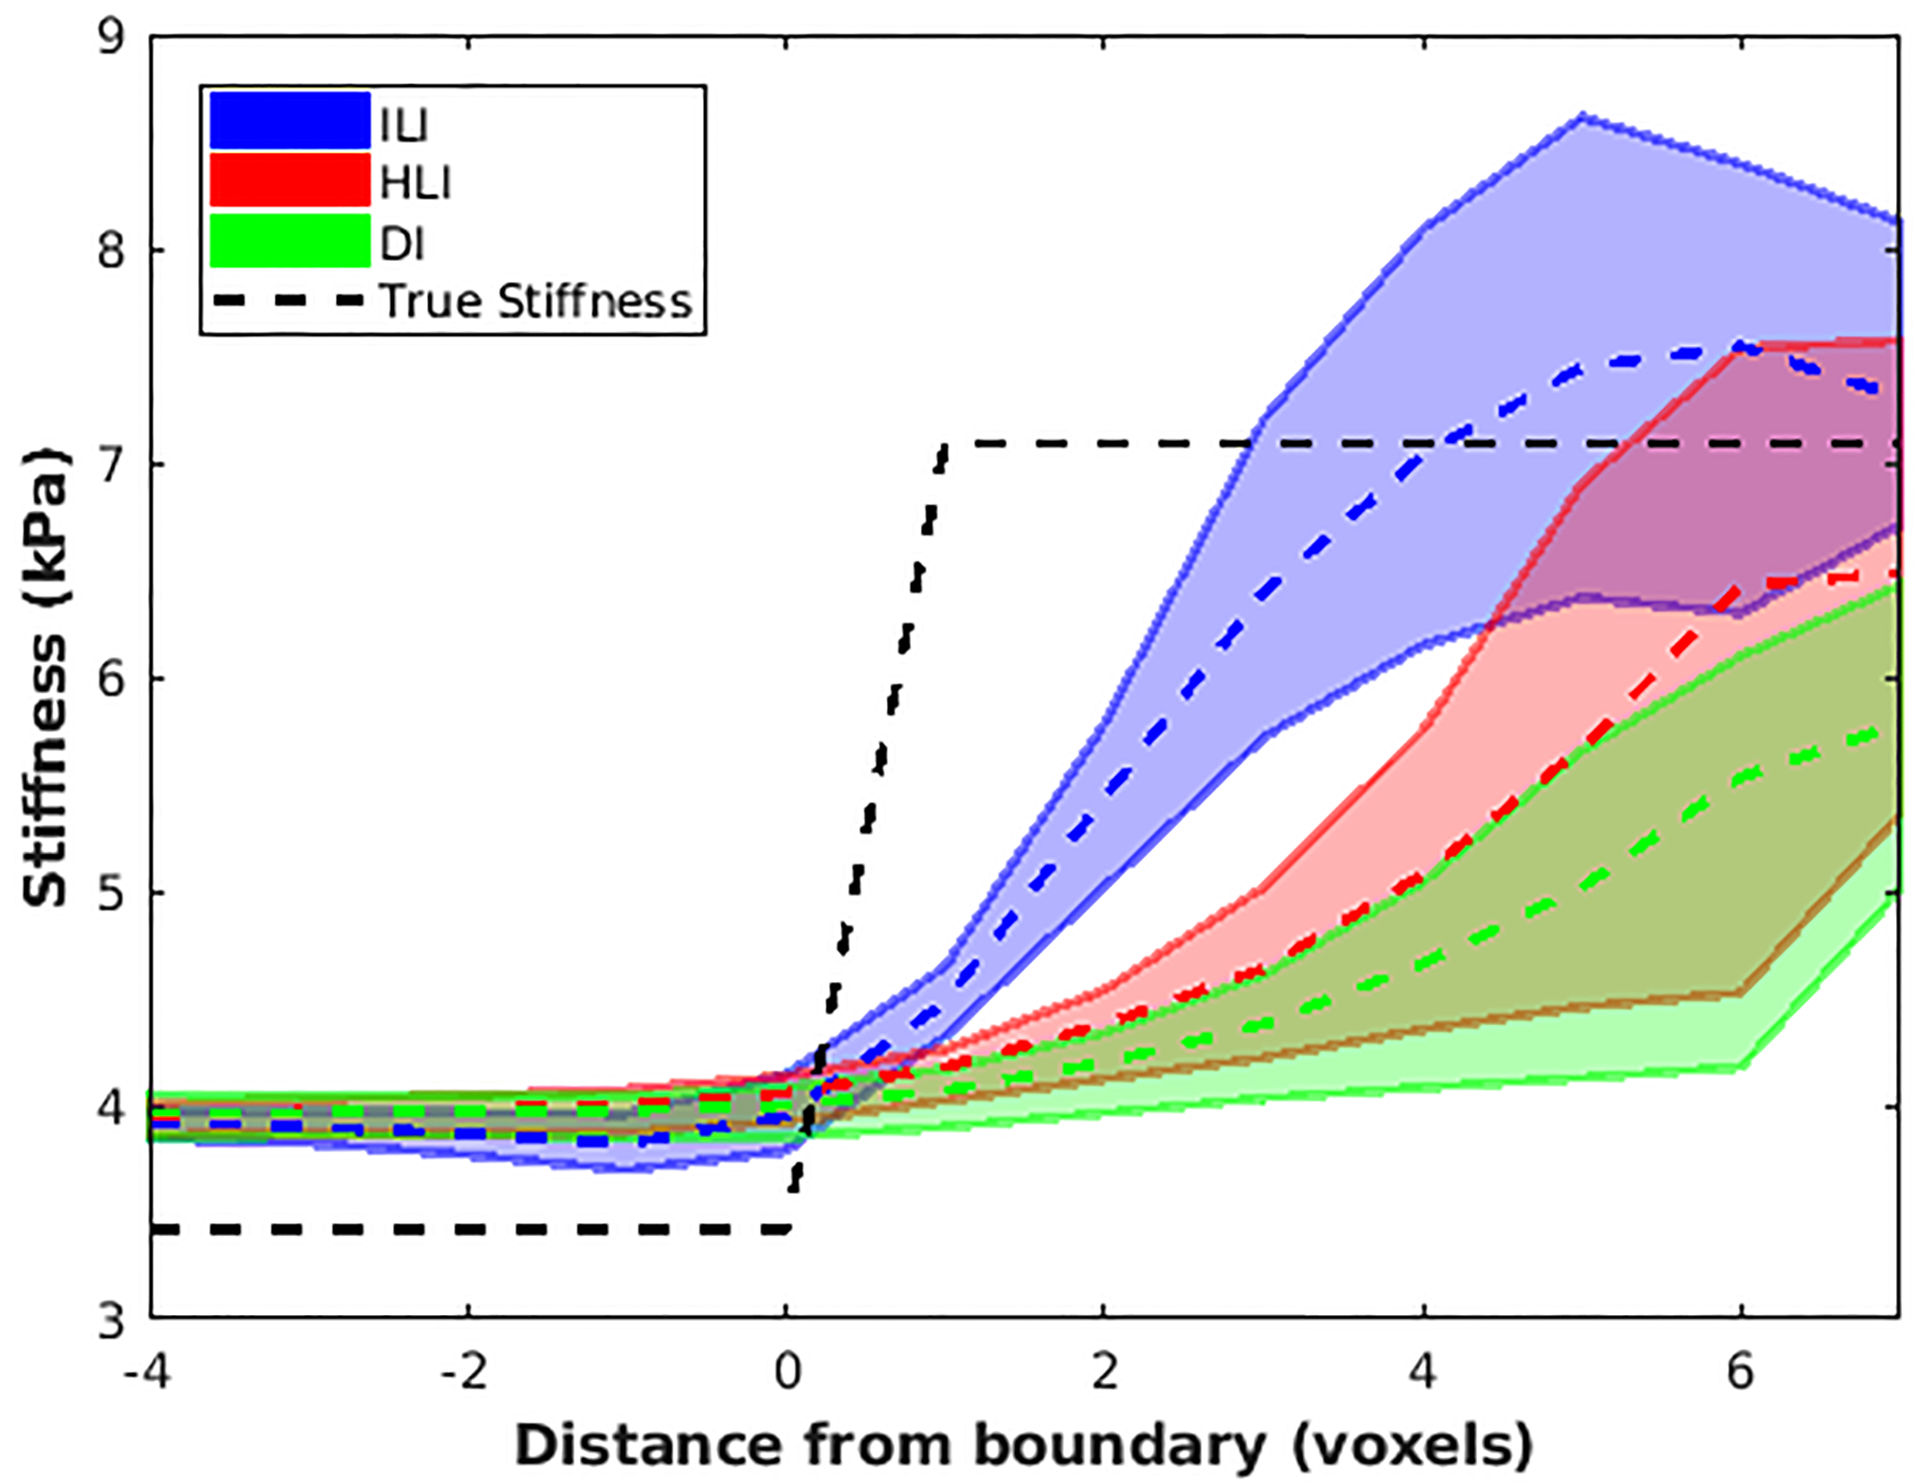
Figure 6. ILI provides sharper transitions at inclusion boundaries.

Negative values on the x-axis represent distance from the boundary into the background while positive values show distance into the inclusion. Dashed lines connect median values at each position while solid lines show the 2.5th and 97.5th percentiles for each inversion.
