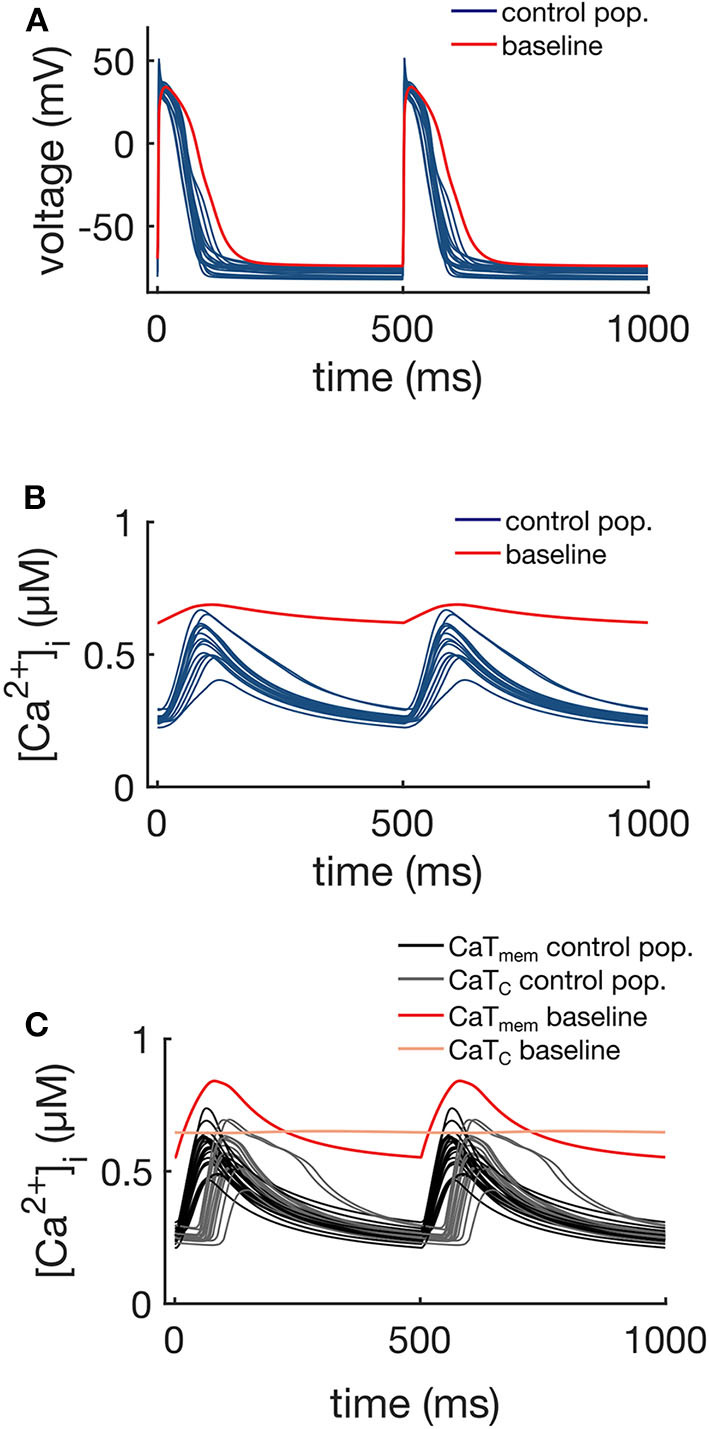
Figure 4.

APs (A), whole-cell CaTs (B), and membrane (CaTm) and center of cell (CaTc) CaTs (C) of the control population (16 models), at 2 Hz steady pacing. The red traces represent the baseline model with the original maximum conductances shown in Table 1.
