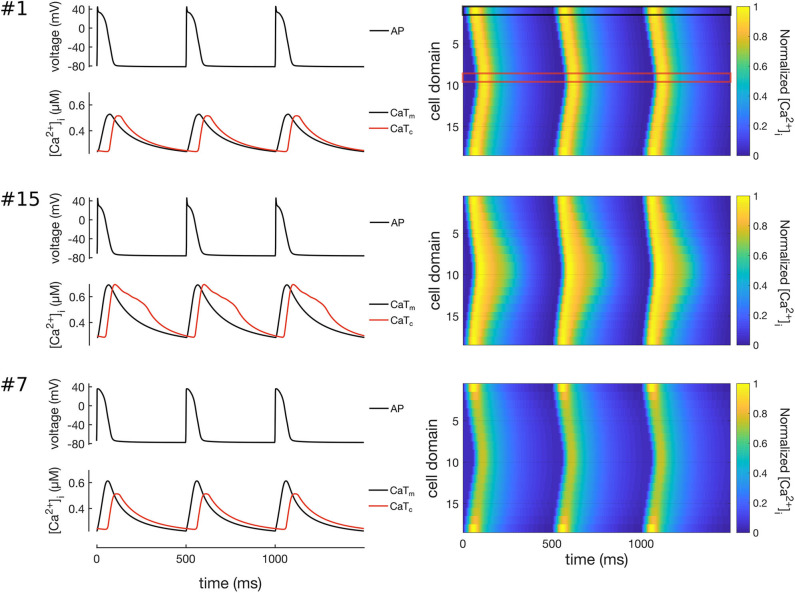
Figure 6.
Simulation of Ca2+ waves in three representative models of the control population (models #1, #7, and #15). Traces on left hand-side show the APs (top), CaTs (bottom) at the membrane (CaTm, black lines) and centre of cell (CaTc, red lines). The right hand-side of the Figure shows line scans of propagating Ca2+ waves in 3 simulated beats at 2 Hz pacing. The black and red boxes on the top-right panel show the domains corresponding to the CaTm and CaTc traces. Model #1 shows a propagating Ca2+ wave where CaTm and CaTc have rather similar morphologies; model #15 shows a Ca2+ wave with slightly larger CaTdelay; and model #7 shows a wave patterns with decreased CaTAc as compared to CaTAm.

