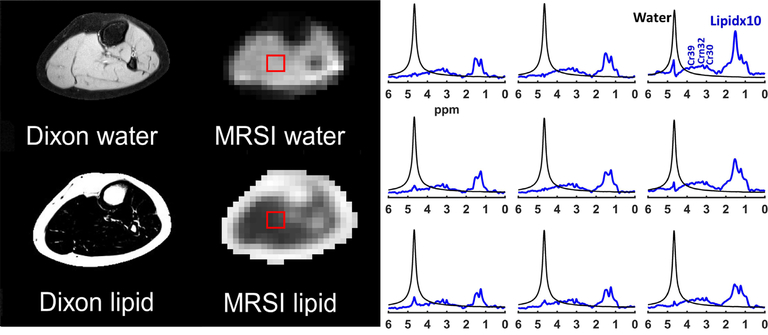
FIGURE 3.
Dixon versus MRSI output. The results of the FID density-weighted concentric ring trajectory (DW-CRT) metabolite cycling MRSI sequence are in line with the Dixon images. On the right, representative water (black) and lipid (blue) spectra acquired from the same location (box) by MRSI. The lipid peaks were magnified ten times compared to the water peak for better visualization

