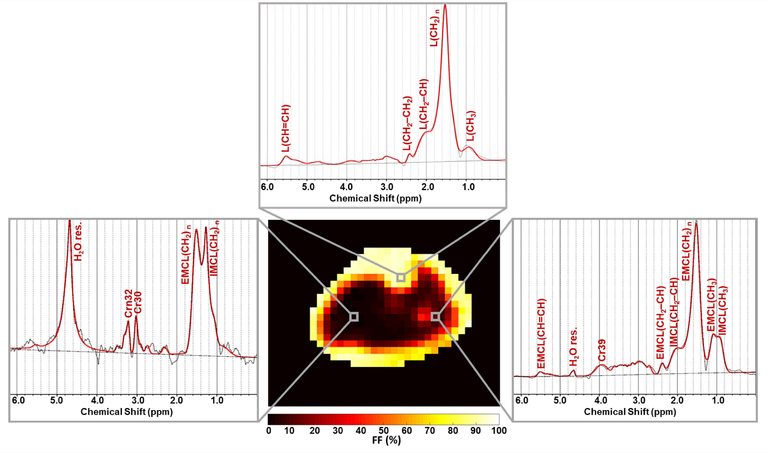
FIGURE 4.
Representative spectra fitted by LCModel from different locations in muscles and bone. The shown spectra (black) were acquired from the voxels highlighted on the total fat fraction map. The LCModel fit is shown in red, with the fitted lipid components labeled. H2O res. stands for the residual water signal. Other metabolites than lipids can also be detected such as CH3 and CH2 groups of creatine that resonate at 3.0 ppm (Cr30) and 3.9 ppm (Cr39), respectively, in addition to the CH3 group of carnitine (Crn32)

