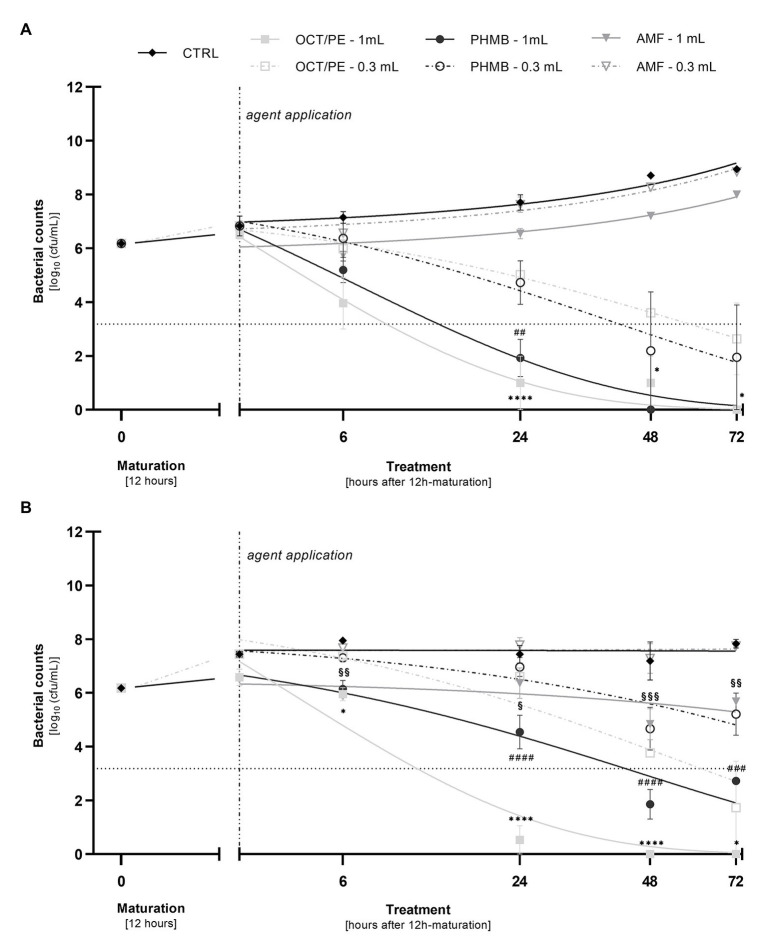
Figure 3.
Comparison of the reduction of P. aeruginosa (A) and MRSA (B) in the biofilm model (hpBIOM) between 0.3 and 1.0 ml of tested antimicrobial substances in a prolonged exposure of up to 72 h. Graphs depict bacterial counts (in log10 cfu/ml) after treatment with octenidine-dihydrochloride/phenoxyethanol (OCT/PE), polyhexanide (PHMB), or 0.2% sodium hypochlorite (AMF) compared to an untreated control (CTRL). Values are expressed as means ± sem and a significant increase in reduction under 1.0 ml substance volume is expressed as *p ≤ 0.05, **p ≤ 0.01, ***p ≤ 0.001, or ****p ≤ 0.0001 (* for PHMB; # for OCT/PE, and § for AMF). Dotted horizontal line indicates the cut-off for a high antimicrobial efficacy (≥3 log10 reduction steps). Dashed vertical line indicates onset of treatment with the different antimicrobial agents after 12 h of biofilm maturation. All experiments were performed in triplicates.

