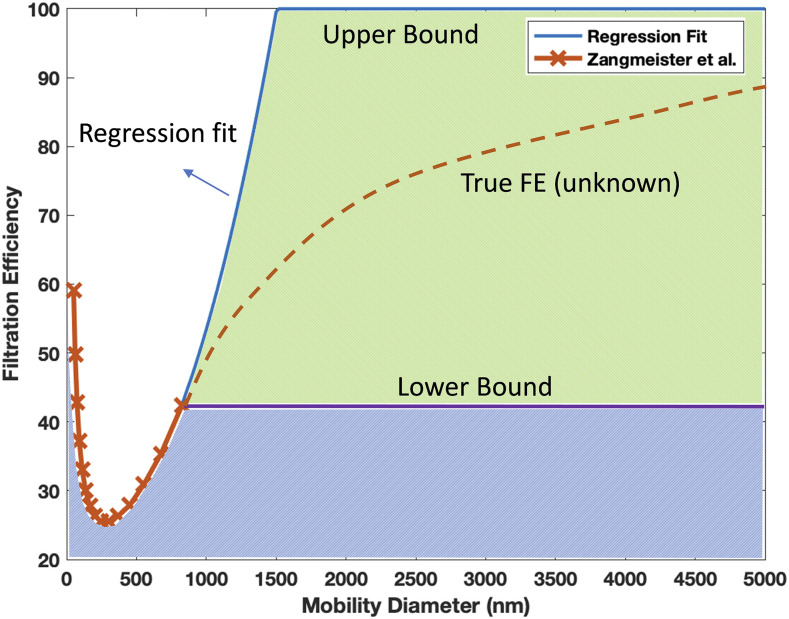
FIG. 9.
Depiction of methodology for estimating the lower and upper bound of the average FE over the 50 nm–5000 nm range from the data of Zangmeister et al.71 This particular example is for the 1× Cotton 13, 2× Synthetic Blend 4 sample. The lower bound is obtained by assuming that the FE for PMDs greater than 825 nm is equal to the FE measured at 825 nm. The upper bound is obtained by employing a regression fit to the right side of the measured curve (beyond the PMD for minimum FE) and extending it to the FE = 100% line. Beyond this, the FE for the upper bound is assumed to equal 100%.

