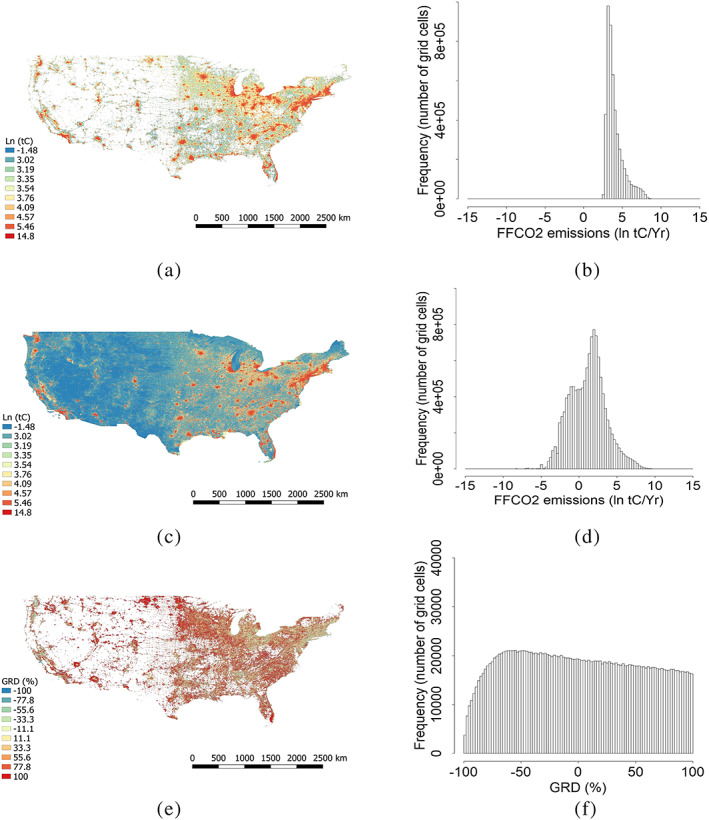
Figure 7.

Comparison of the ODIAC and Vulcan total FFCO2 emissions as mapped distributions (left) and frequency histograms (right) for contiguous United States only: (a, b) ODIAC total FFCO2 emissions; (c, d) Vulcan total FFCO2 emissions; (e, f) GRD values ({ODIAC‐Vulcan}/Vulcan) (values larger than 99% and smaller than −99% were excluded from the GRD frequency distribution).
