
Figure 3.
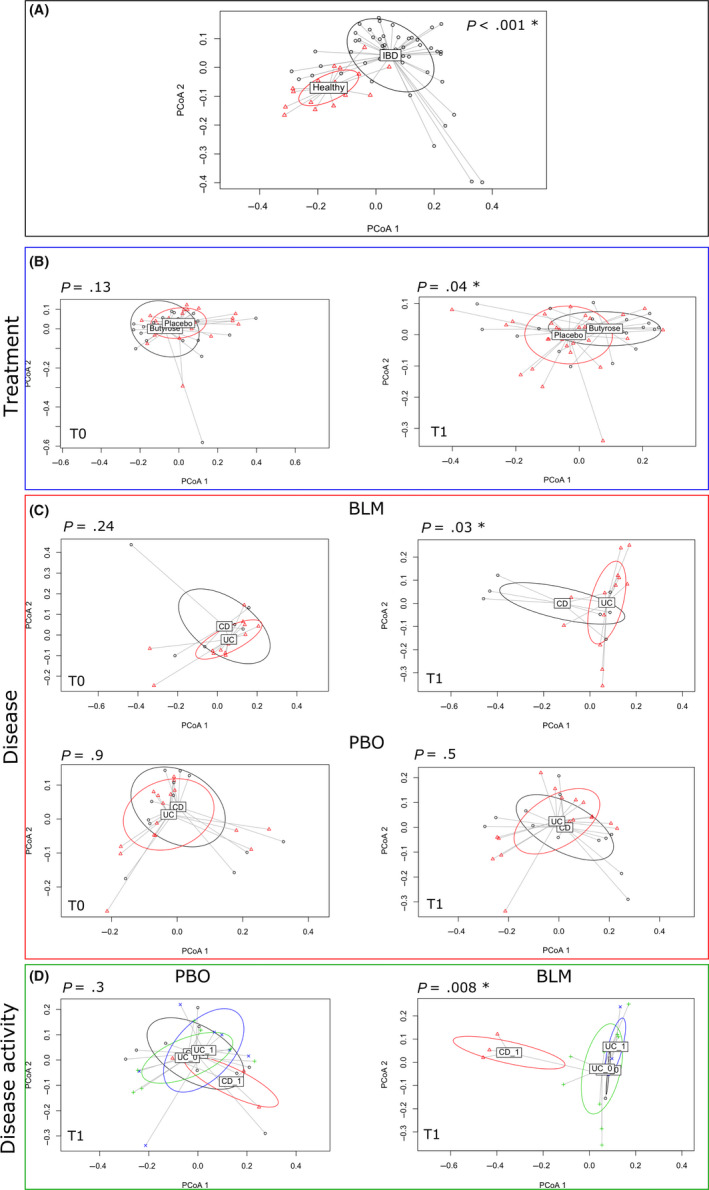
PERMANOVA tests if samples can be significantly separated accordingly to different variables (eg, treatment or type of disease). The figure shows the principal coordinate analysis considering the samples grouped according to (A) healthy and IBD status, (B) treatment (placebo and butyrose) at T0 = baseline and T1 = post‐treatment, (C) disease (UC and CD) undergoing BLM or PBO treatment at T0 and T1 timepoint, and (D) disease activity (1 indicates an active disease, while 0 a non‐active disease). The P‐value derived from the PERMANOVA test is reported for each comparison, and significant P‐value (<0.05) is indicated with a star