
Figure 5.
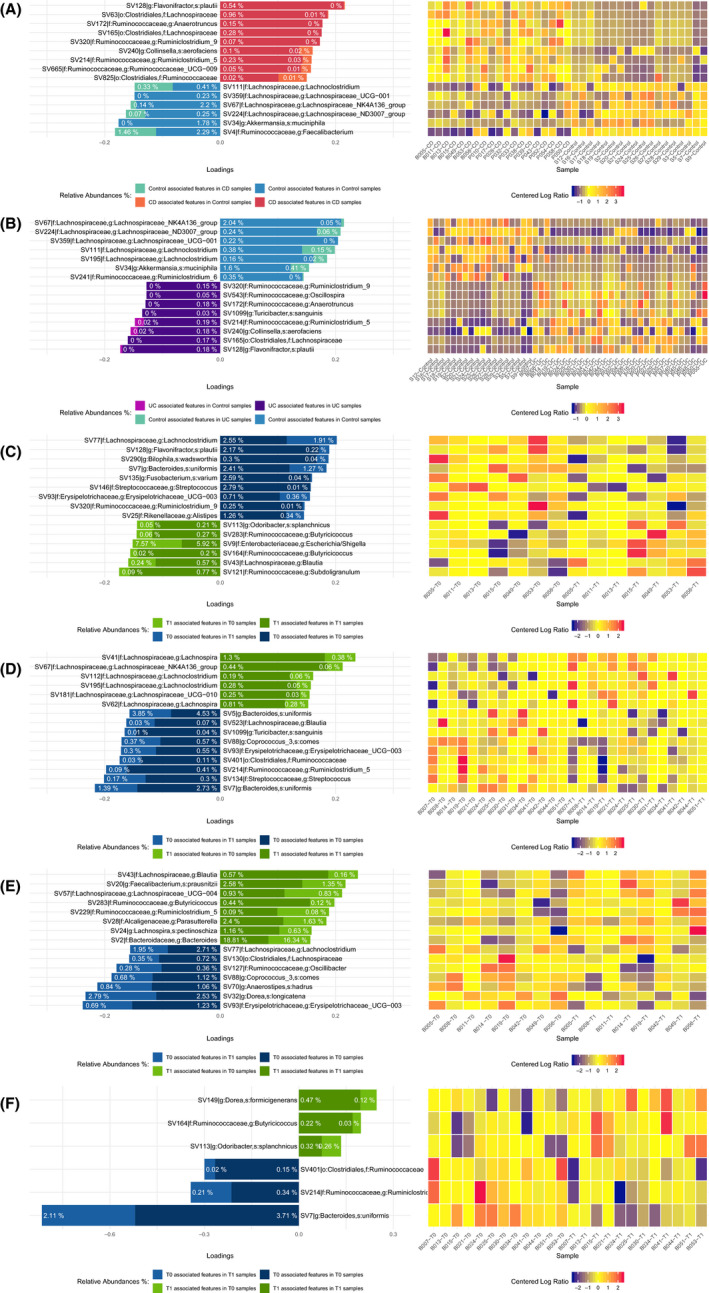
sPLS‐DA analysis identified a subset of discriminant ASVs: for each ASV, a loading value that represents the discriminant power of that ASV in explaining differences between 2 examined conditions. The higher the absolute value, the bigger is the discriminative power. The loading value plots display the top 15 (panels A‐E) and top 6 (panel F) discriminant ASVs for each comparison. Percentages shown in the bars represent the mean relative abundances of each ASV in the considered conditions. The dark color and a light color of each bar represent the average relative abundance (in percentage) of an ASV in the considered comparison