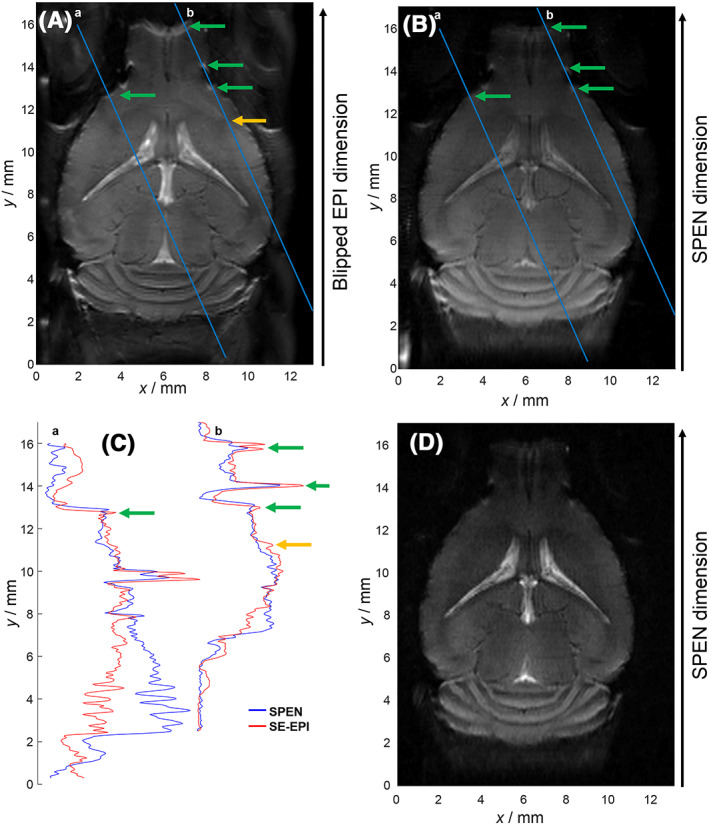
FIGURE 2.

Comparison between images resulting from SE‐EPI and SPEN experiments on an in vivo mouse brain coronal slice at 15.2 T using identical shim conditions. All images were acquired with a three‐segment acquisition and had in‐plane resolutions of 100 × 100 µm² and a slice thickness of 700 µm. A, High‐SNR SE‐EPI image recorded with 48 averages leading to an acquisition time of 2 min and 24 seconds. The SE‐EPI sequence had an echo time of 30 ms and an effective bandwidth in the blipped dimension of 7.57 kHz. This image exhibits ghost artifacts like the one shown by the orange arrow and B 0 inhomogeneity artifacts like those shown by the green arrows. B, High‐SNR fully T 2*‐refocused SPEN image recorded with 48 averages leading to an acquisition time of 2 min and 24 seconds. The fully T 2*‐refocused SPEN image was acquired with echo times of 40.5 ± 11.5 ms and an effective SPEN‐dimension bandwidth of 10.45 kHz. The increased bandwidth combined with the full T 2*‐refocusing lead to the higher robustness to B 0 inhomogeneity artifacts compared to the SE‐EPI image, while SPEN’s referenceless reconstruction algorithm 47 allows one to minimize ghost artifacts. C, Comparison of normalized profiles extracted from the aforementioned SE‐EPI and SPEN images along the blue lines. Arrows indicate the above‐mentioned artefacts. D, b 0 SPEN image acquired with eight averages leading to an acquisition time of 24 seconds and an echo time increased to 59 ± 11.5 ms due to the inclusion of a diffusion delay (T diff) of 18 ms. This image was denoised using random matrix theory 60 and a 3 × 3 bidimensional kernel, and is representative of the sets employed in the subsequent DTD calculations
