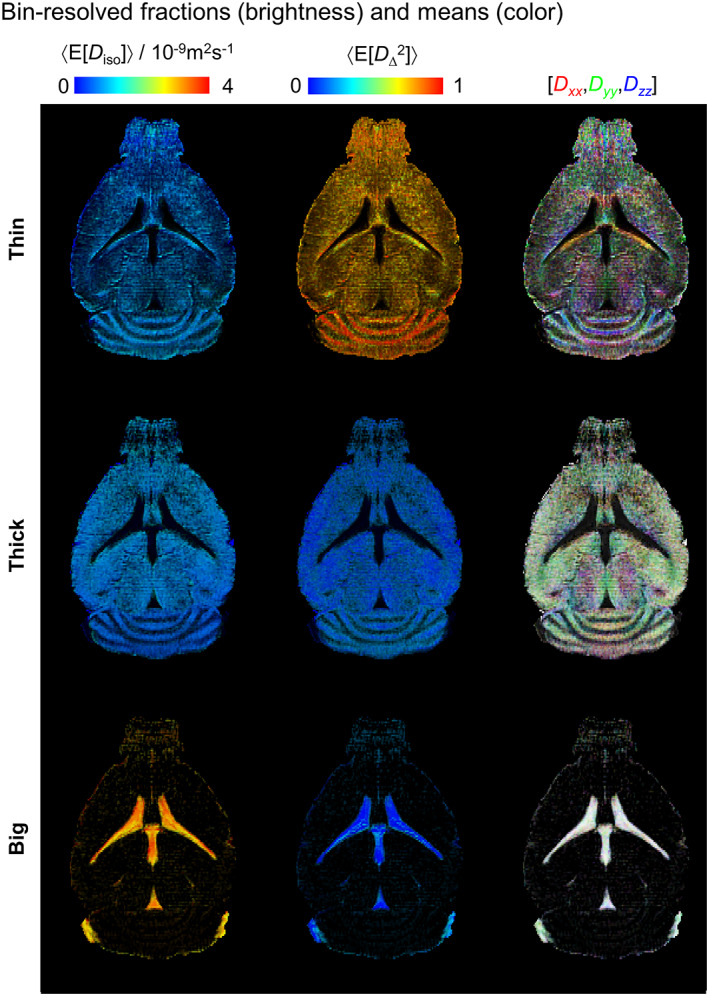
FIGURE 5.

Parameter maps derived from subsets (“bins”) of the 4D DTD space. Per‐bin signal fractions (brightness) and per‐bin average mean values (color) are shown for the isotropic diffusivity 〈E[D iso]〉, the squared normalized diffusion anisotropy 〈E[D Δ 2]〉, and the diffusion tensor orientation 〈E[Orientation]〉. The values of 〈E[D iso]〉 and 〈E[D Δ 2]〉 are indicated by the corresponding linear color scales, while the 〈E[Orientation]〉 maps are color‐coded as [R, G, B] = [Dxx,Dyy,Dzz]/max(Dxx,Dyy,Dzz), where Dii are the i‐th diagonal elements of the diffusion tensor as measured in the laboratory frame of reference
