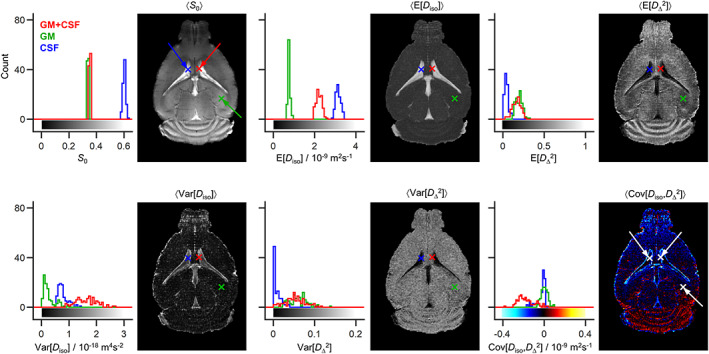
FIGURE 6.

Statistical descriptors derived from the 4D diffusion tensor distributions (DTDs) introduced in Figures 4 and 5. For each voxel, the bootstrapping yields 96 different DTDs consistent with the signal data. The sets of DTDs were converted to sets of the following statistical descriptors: total signal amplitude S 0, mean E[x], variance Var[x] and covariance Cov[x,y], for the isotropic diffusivity D iso and the squared normalized diffusion anisotropy D Δ 2. The parameter maps show 〈S 0〉, 〈E[x]〉, 〈Var[x]〉 and 〈Cov[x,y]〉, where the angular brackets indicate averages over these 96 bootstrap realizations. The results from all 96 bootstrap realizations are also shown as histograms for three selected voxels containing gray matter (GM, in green), cerebrospinal fluid (CSF in blue), and a binary mixture of GM and CSF (GM + CSF, in red). The linear color scales of the various maps are indicated by the bars along the horizontal axes of the corresponding histograms
