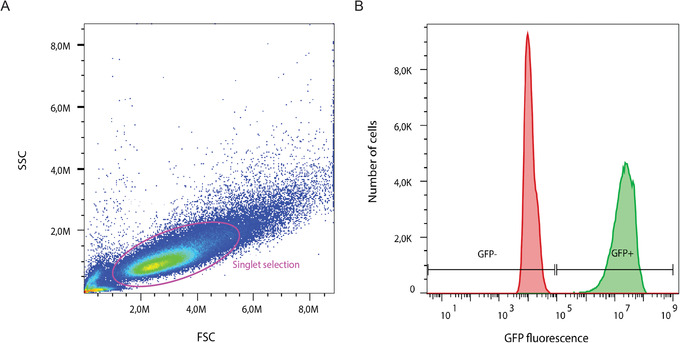
Figure 6.

Representative flow cytometry analysis of a GFP reporter lentivirus. Singlet cells were isolated from the entire population by strict gating, in pink (A). The positive‐control (green) and negative‐control (red) samples were overlaid and used to set appropriate gates for GFP positivity (+) or negativity (–) (B). SSC, side scatter; FSC, forward scatter. GFP fluorescence intensity is shown in arbitrary units.
