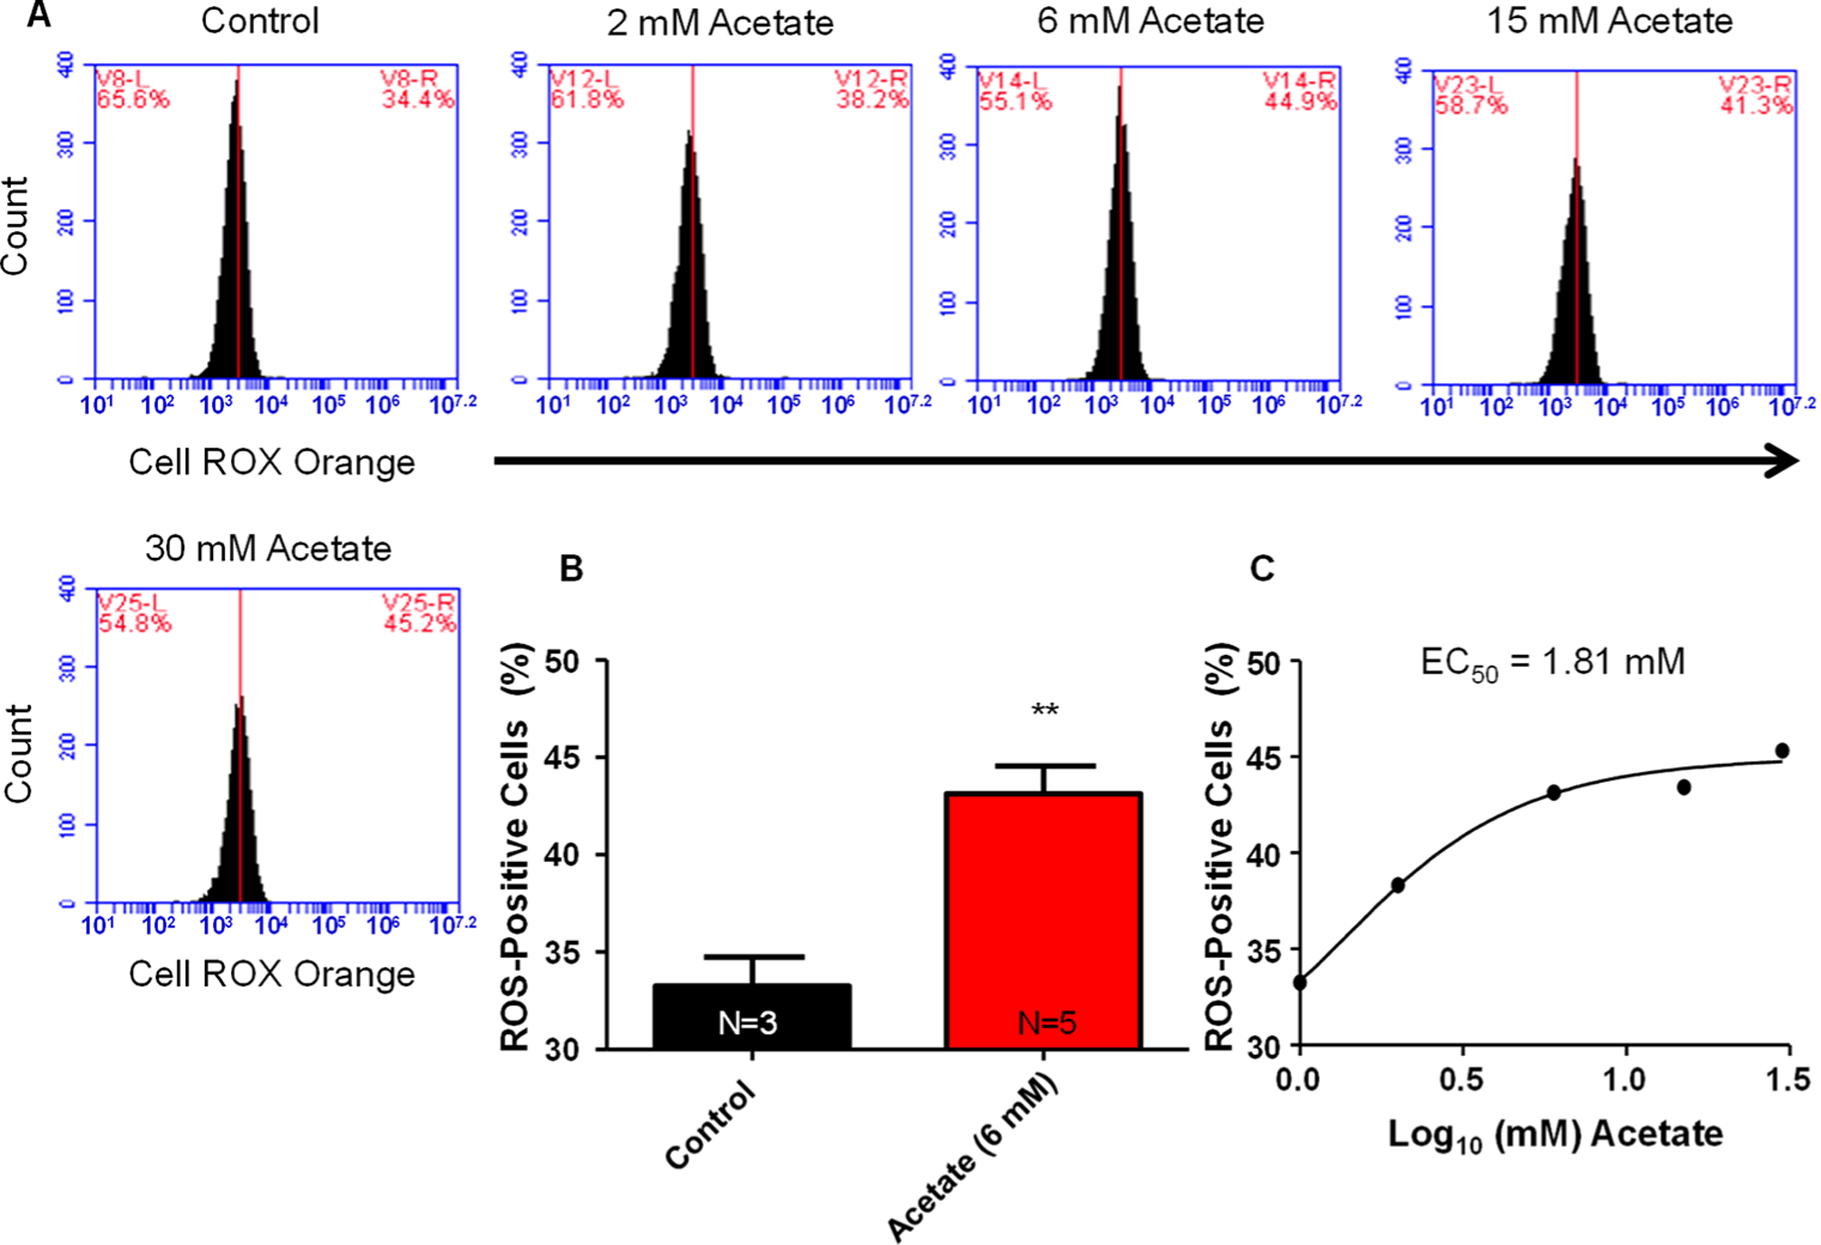
Figure 3.

Acetate increases cytosolic reactive oxygen species. (A) Representative flow cytometry charts for cytosolic ROS fluorescence with various concentrations of acetate. (B) Summary data for acetate (6 mM) on increases in cytosolic ROS production. Acetate (6 mM) significantly (**P < 0.01) increased cytosolic ROS percentage, 44.1 ± 1.4%, compared to baseline values of 33.3 ± 1.5%. (C) Dose-response curve for acetate on changes in cytosolic ROS. EC50 value calculated from the dose-response curve indicating a value of 1.81 mM acetate. (N = number of wells per treatment; each well analyzed for 10,000 events per well.)
