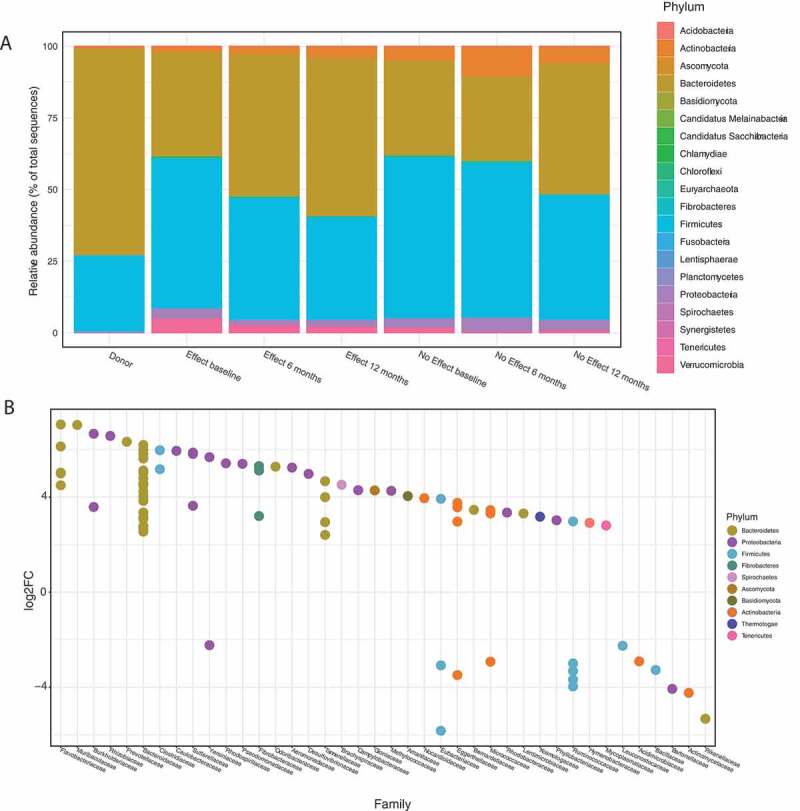
Figure 2.

Panel A: Relative abundance of the most prevalent phyla for the seven groups. The data were filtered so that taxa not seen more than 5 times in at least 20% of the samples in the total dataset were removed. Following this, only taxa with a mean greater than 10−5 (fractional abundance > 0.00001) were kept before agglomeration at phylum level. Panel B: Differential abundance calculated with DESeq2 at phylum and family level, in the Effect group, 12 months vs. baseline. Positive log2FC indicate enriched taxa after FMT, negative log2FC indicate decreased taxa after FMT. Families indicated on the X-axis are colored according to phyla. FDR cut off for inclusion in the plot was < 10−4.
