
Figure 3.
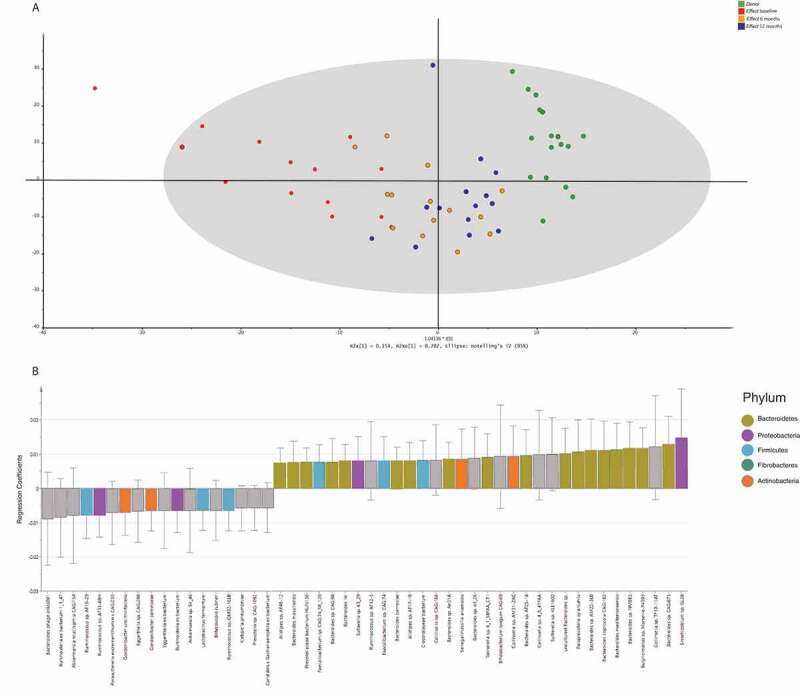
Multivariate regression analysis of the bacterial species. Each sample was labeled according to the corresponding study group. Panel A: This t1/t2-score plot of the orthogonal partial least squares projection to latent structures (OPLS) model (one predictive component and one orthogonal component) was built from the bacterial species composition in stool samples taken from the Donors, and from the Effect group at 3 time points: baseline, 6, and 12 months after FMT. The performance parameters R2Xcum, R2Ycum and Q2cum were 0.36, 0.61 and 0.32, respectively. Panel B: The top 50 bacterial species ranked by regression coefficients pertaining to the predictive components. To make the coefficients readily comparable, the independent variables for different taxa were scaled and centered prior to the analysis. The error bars indicate the confidence intervals of the coefficients. The coefficient is considered significant (above noise level), when the confidence interval does not include zero. Significant features are color-coded according to phylum.