Figure 3.

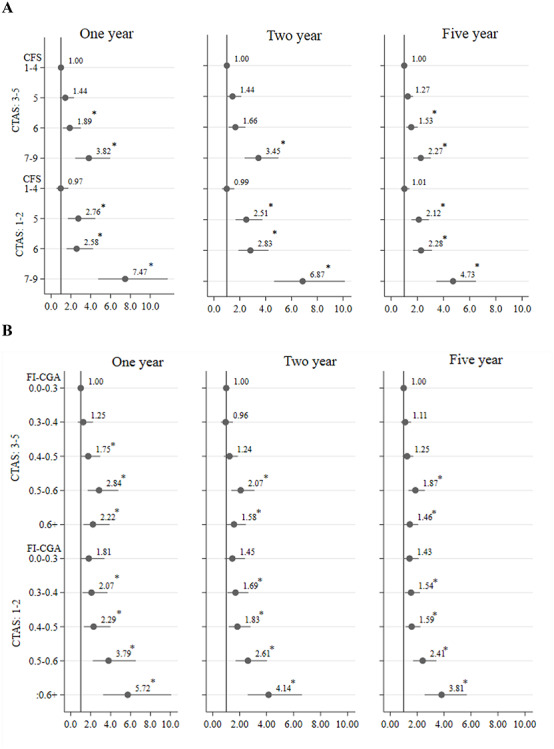
Hazard ratios for mortality based on acuity (CTAS) and frailty [CFS (panel a), FI-CGA (panel b)]. Note: People with CFS 1–4 and 7–9 and FI-CGA 0–0.03 and 0.6+ were combined due to low sample size; *P < 0.05.

Hazard ratios for mortality based on acuity (CTAS) and frailty [CFS (panel a), FI-CGA (panel b)]. Note: People with CFS 1–4 and 7–9 and FI-CGA 0–0.03 and 0.6+ were combined due to low sample size; *P < 0.05.