
Figure 4.
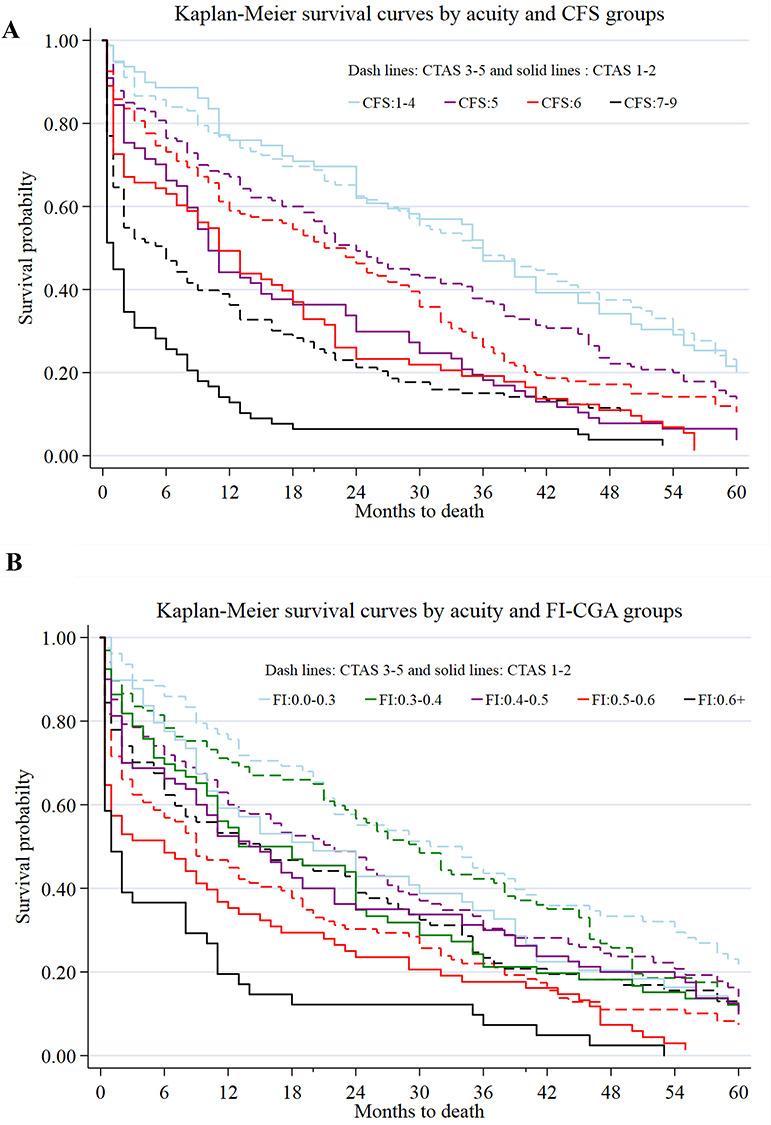
Survival probability by CTAS and frailty [CFS (panel a), FI-CGA (panel b)]. Note: People with CFS 1–4 scores were combined due to low sample size, as were those with CFS scores 7–9, and FI-CGA 0–0.03 and 0.6+.
Official websites use .gov
A
.gov website belongs to an official
government organization in the United States.
Secure .gov websites use HTTPS
A lock (
) or https:// means you've safely
connected to the .gov website. Share sensitive
information only on official, secure websites.
Survival probability by CTAS and frailty [CFS (panel a), FI-CGA (panel b)]. Note: People with CFS 1–4 scores were combined due to low sample size, as were those with CFS scores 7–9, and FI-CGA 0–0.03 and 0.6+.