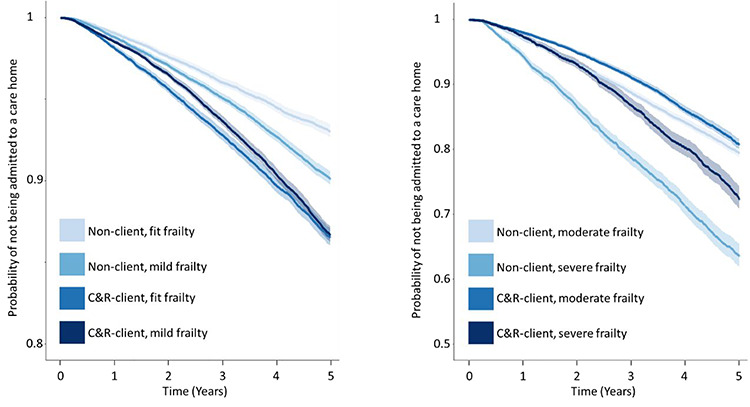
Figure 1.

Kaplan–Meier survival curves for the probability of not moving to a care home, stratified by C & R status and eFI category: (a) The Kaplan–Meier curves for individuals with frailty statuses defined as fit and mild, (1) the probability scale is defined on the interval from 0.8 to 1. (b) The Kaplan–Meier curves for individuals with frailty statuses defined as moderate and severe, (2) the probability scale is defined on the interval from 0.5 to 1.
