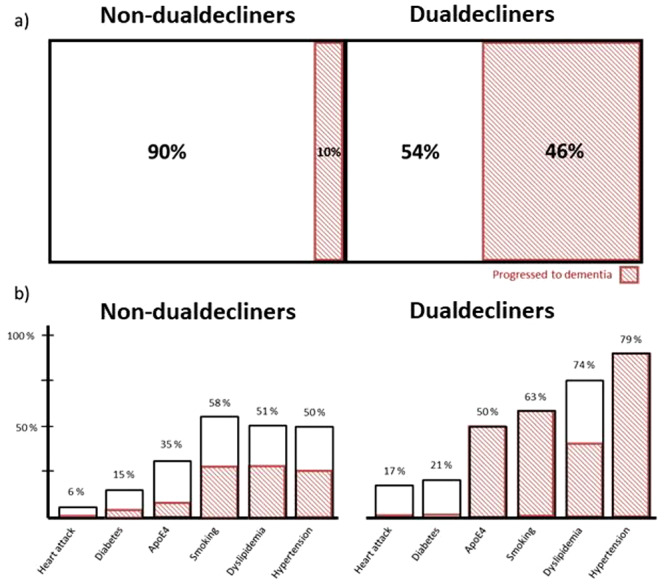
Figure 1.

Differences between the dual and non-dual decliners groups. (a) The proportion of participants that progressed to dementia (shaded) between the groups. (b) The proportion of participants that present different comorbidities between the groups, as well as the proportion of individuals that had those comorbidities and progressed to dementia (shaded).
