
Figure 4|. Senolytic CAR T cells are therapeutic in NASH-induced liver fibrosis.
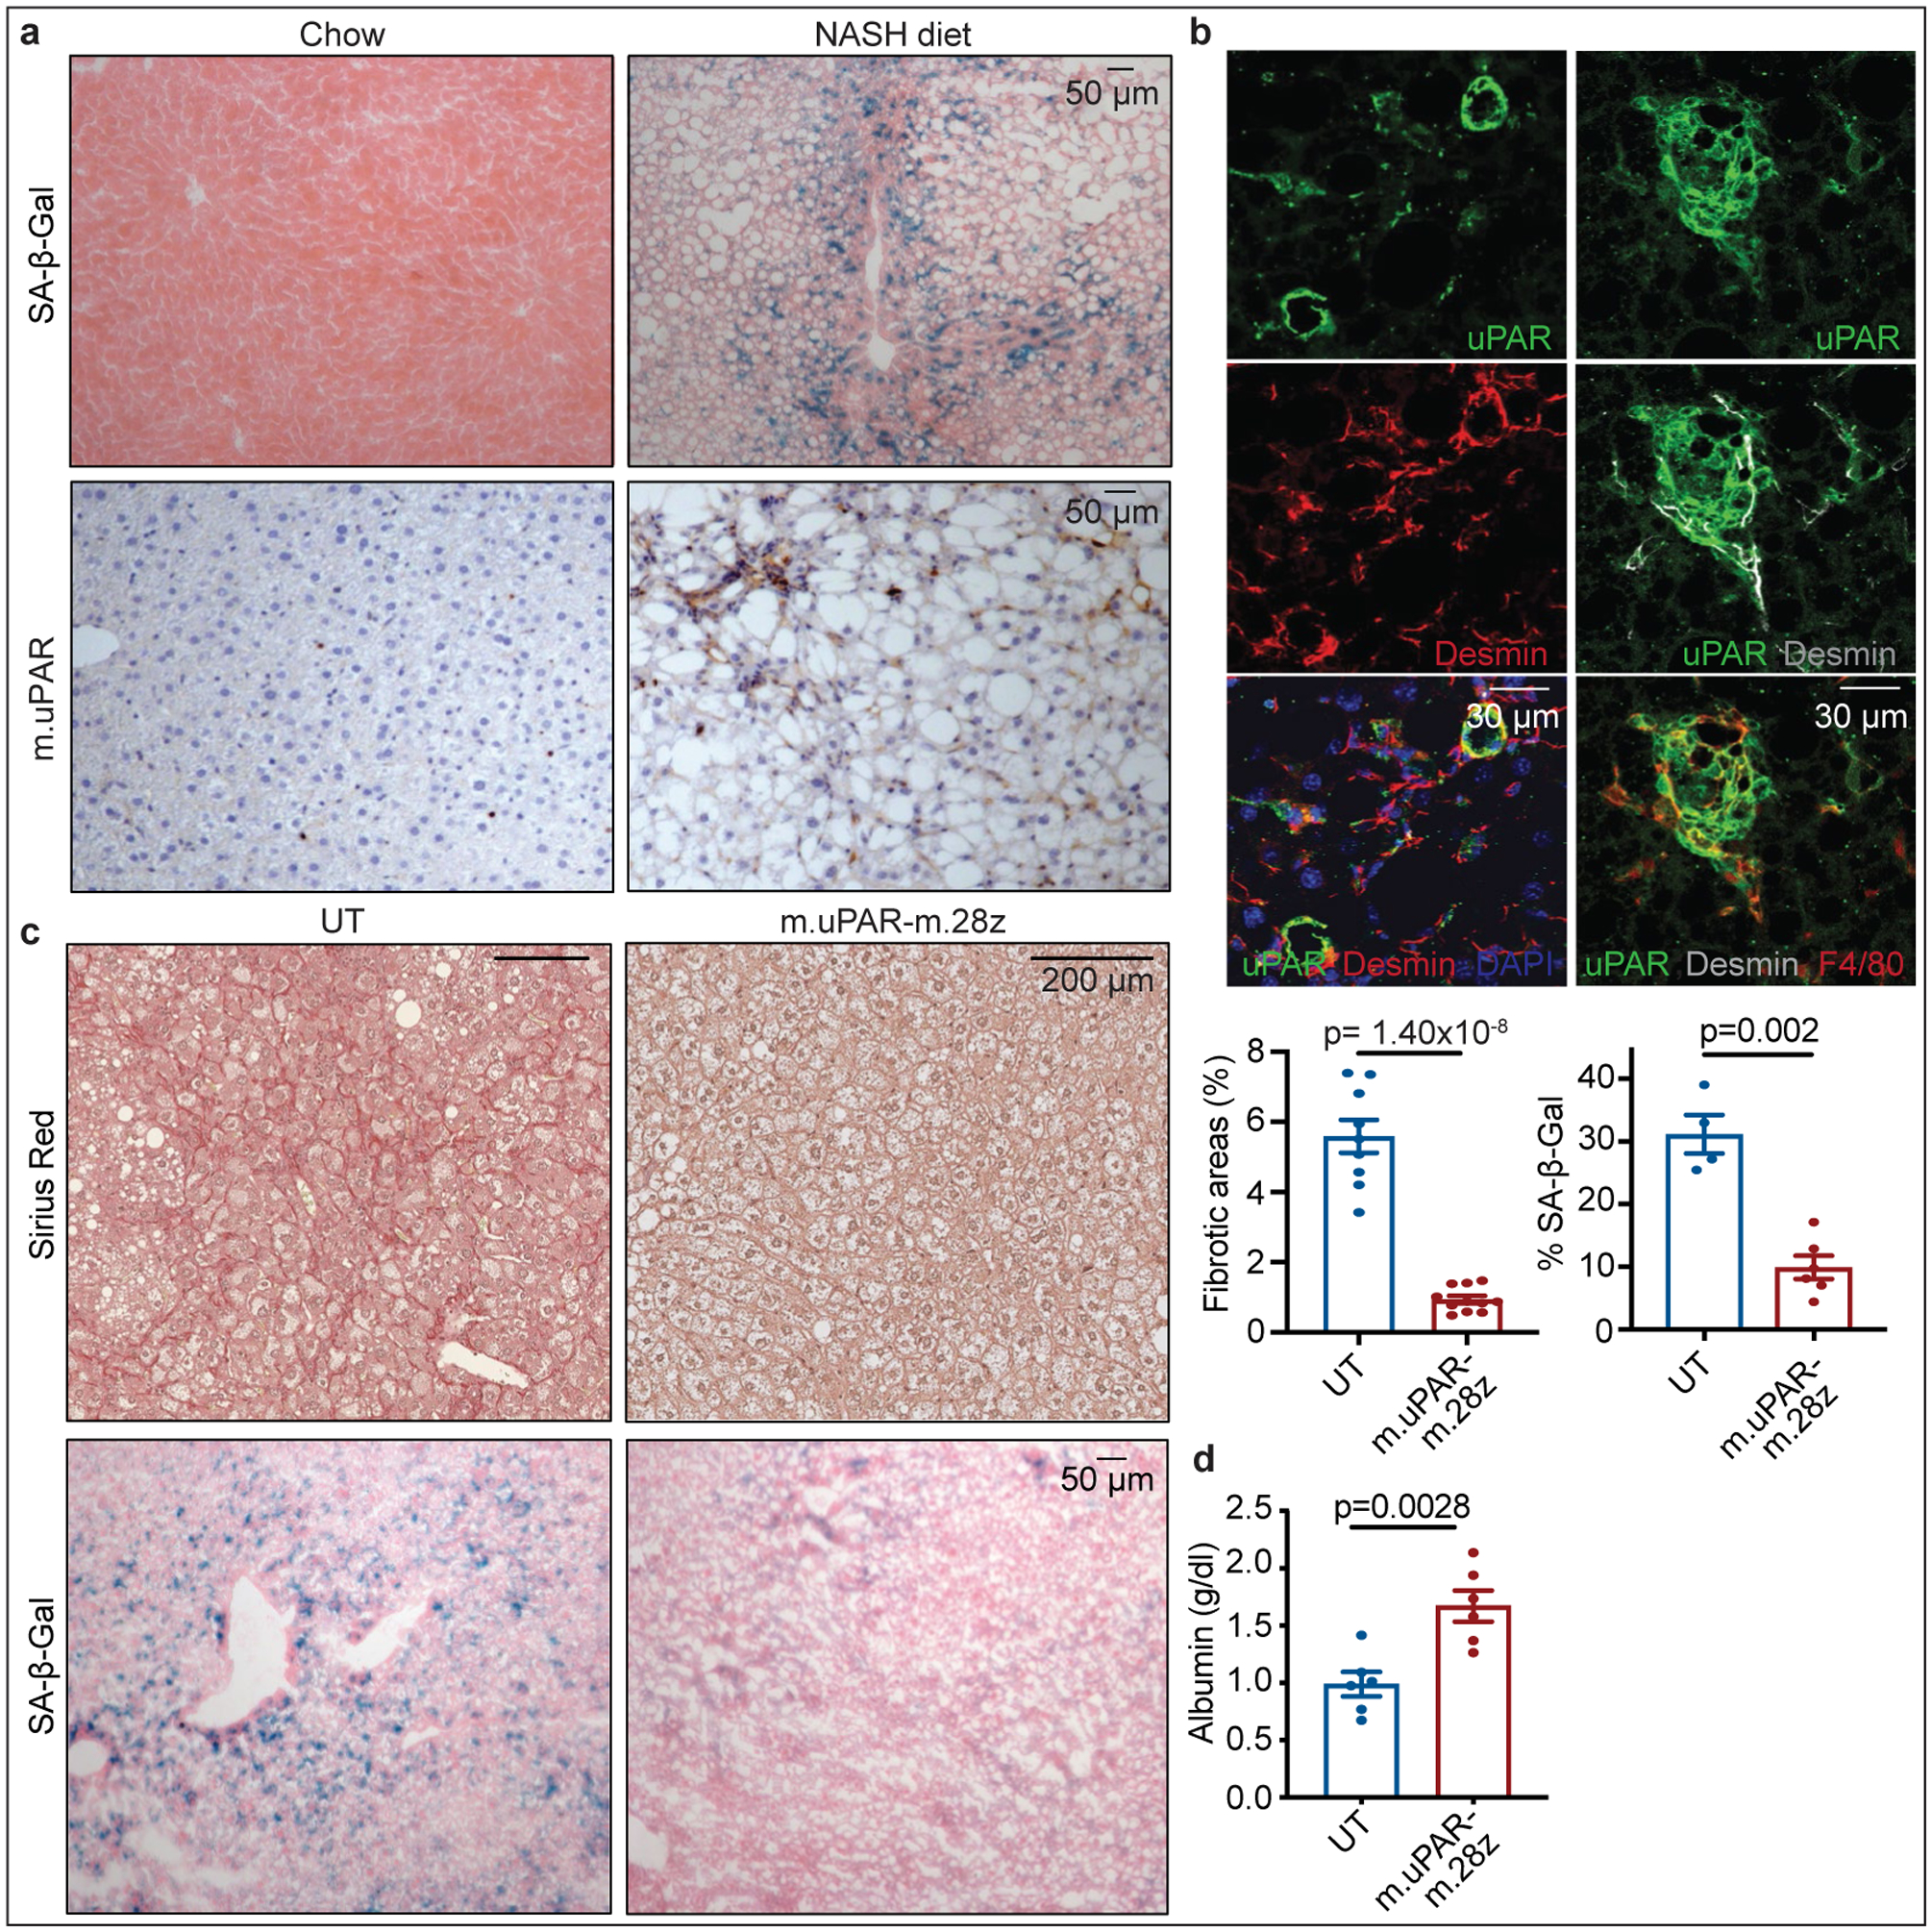
(a,b) Representative stainings in the livers of mice treated with chow or NASH diet for 3–4 months. (a) Immunohistochemical staining of m.uPAR and SA-β-Gal (n=3 mice per group) (b) Co-immunofluorescence staining of m.uPAR (green), desmin (red in left panel, gray in right panel) and F4/80 (red). Representative results of n=2 independent experiments (n=3 mice per group). (c-d) Mice treated with NASH diet for 3 months were injected with 0.5×10⁶ m.uPAR-m.28z CAR T cells or untransduced (UT) T cells. Liver and serum analyses were performed 20 days later. (c) Representative Sirius red staining, SA-β-Gal expression and quantifications (Sirius red: UT: n=9 mice, m.uPAR-m.28z: n=11. SA-β-Gal: UT: n= 4 mice, m.uPAR-m.28z: n=6). (d) Serum albumin levels (UT and m.uPAR-m.28z: n=6). (c-d) Results of n=2 independent experiments. Data are mean± SEM. Two-tailed unpaired Student’s t-test.