
Extended Data Fig.2|. uPAR is a cell surface and secreted biomarker of senescence.
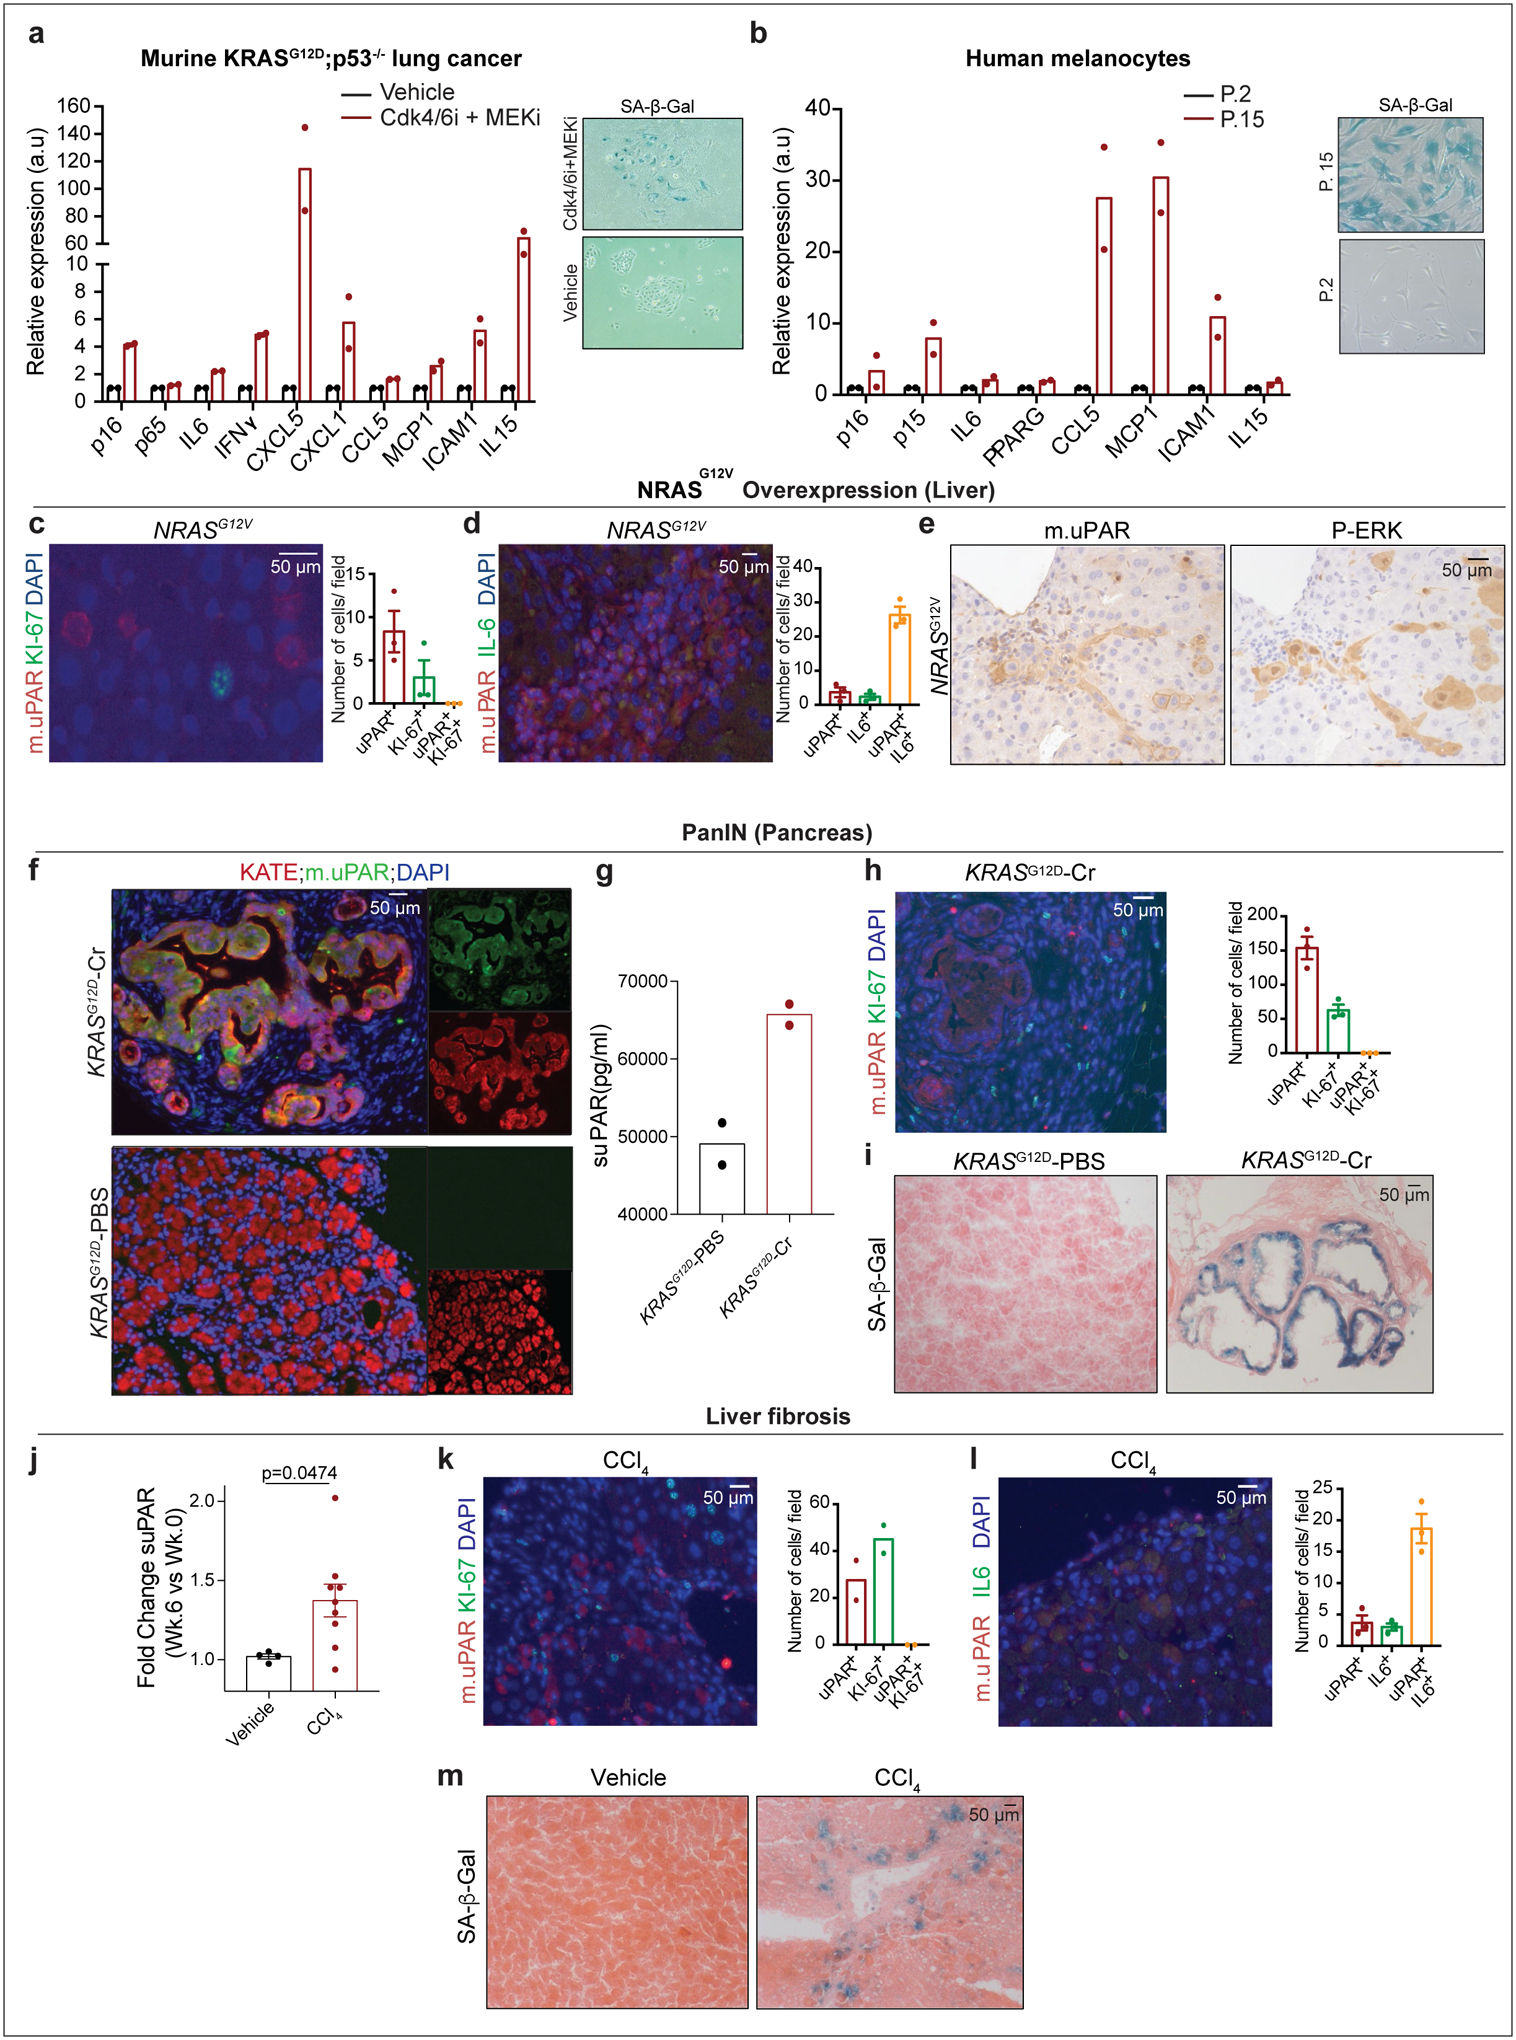
(a-b) qRT-PCR of SASP gene expression in senescent versus proliferating (a) KRASG12D;p53−/− (KP) tumor cells or (b) human primary melanocytes and representative SA-β-Gal stainings. (c-e) Co-immunofluorescence stainings and quantifications of (c) m.uPAR (red) and ki-67 (green) or (d) m.uPAR (red) and IL6 (green) and (e) immunohistochemical staining of m.uPAR or P-ERK in serial sections in murine livers 6 days after hydrodynamic tail vein injection (HTVI) with a plasmid encoding NRASG12V. Representative results of 2 independent experiments (n=3 mice per group). (f-i) Mice expressing endogenous KRASG12D in pancreatic epithelial cells were treated with cerulean (Cr) and harvested 21 weeks afterwards when they had developed PanINs. Mice with normal pancreas (KRAS WT PBS) were used as controls. (f) Co-immunofluorescence staining of KATE (red) and m.uPAR (green). Representative results of 2 independent experiments (n=3 mice per group). (g) Levels of soluble uPAR (suPAR) in the mice shown in (f). Representative results of 2 independent experiments (n=2 mice per group). (h) Co-immunofluorescence stainings and quantifications of m.uPAR (red) and ki-67 (green). Representative results of 2 independent experiments (n=3 mice per group). (i) Representative SA-β-Gal staining. Representative results of 1 independent experiment (n=3 mice per group). (j-m) Mice were treated with either vehicle or CCl4 semiweekly for 6 weeks to induce liver fibrosis. (j) Fold change in the serum levels of suPAR. Representative results of 2 independent experiments (Vehicle: n=4, CCl4: n=9 mice per group). (k) Co-immunofluorescence staining and quantification of m.uPAR (red) and ki-67 (green). Representative results of 2 independent experiments (n=2 mice per group). (l) Co-immunofluorescence staining and quantification of m.uPAR (red) and IL-6 (green). Representative results of 2 independent experiments (n=3 mice per group). (m) Representative SA-β-Gal staining. Representative results of 2 independent experiments (n=3 mice per group). (j) Two-tailed unpaired Student’s t-test. Data represent mean± SEM (c,d,h,j,l).