
Extended Data Fig.8|. Safety profile of m.uPAR-m.28z CAR T cells at supratherapeutic T cell doses.
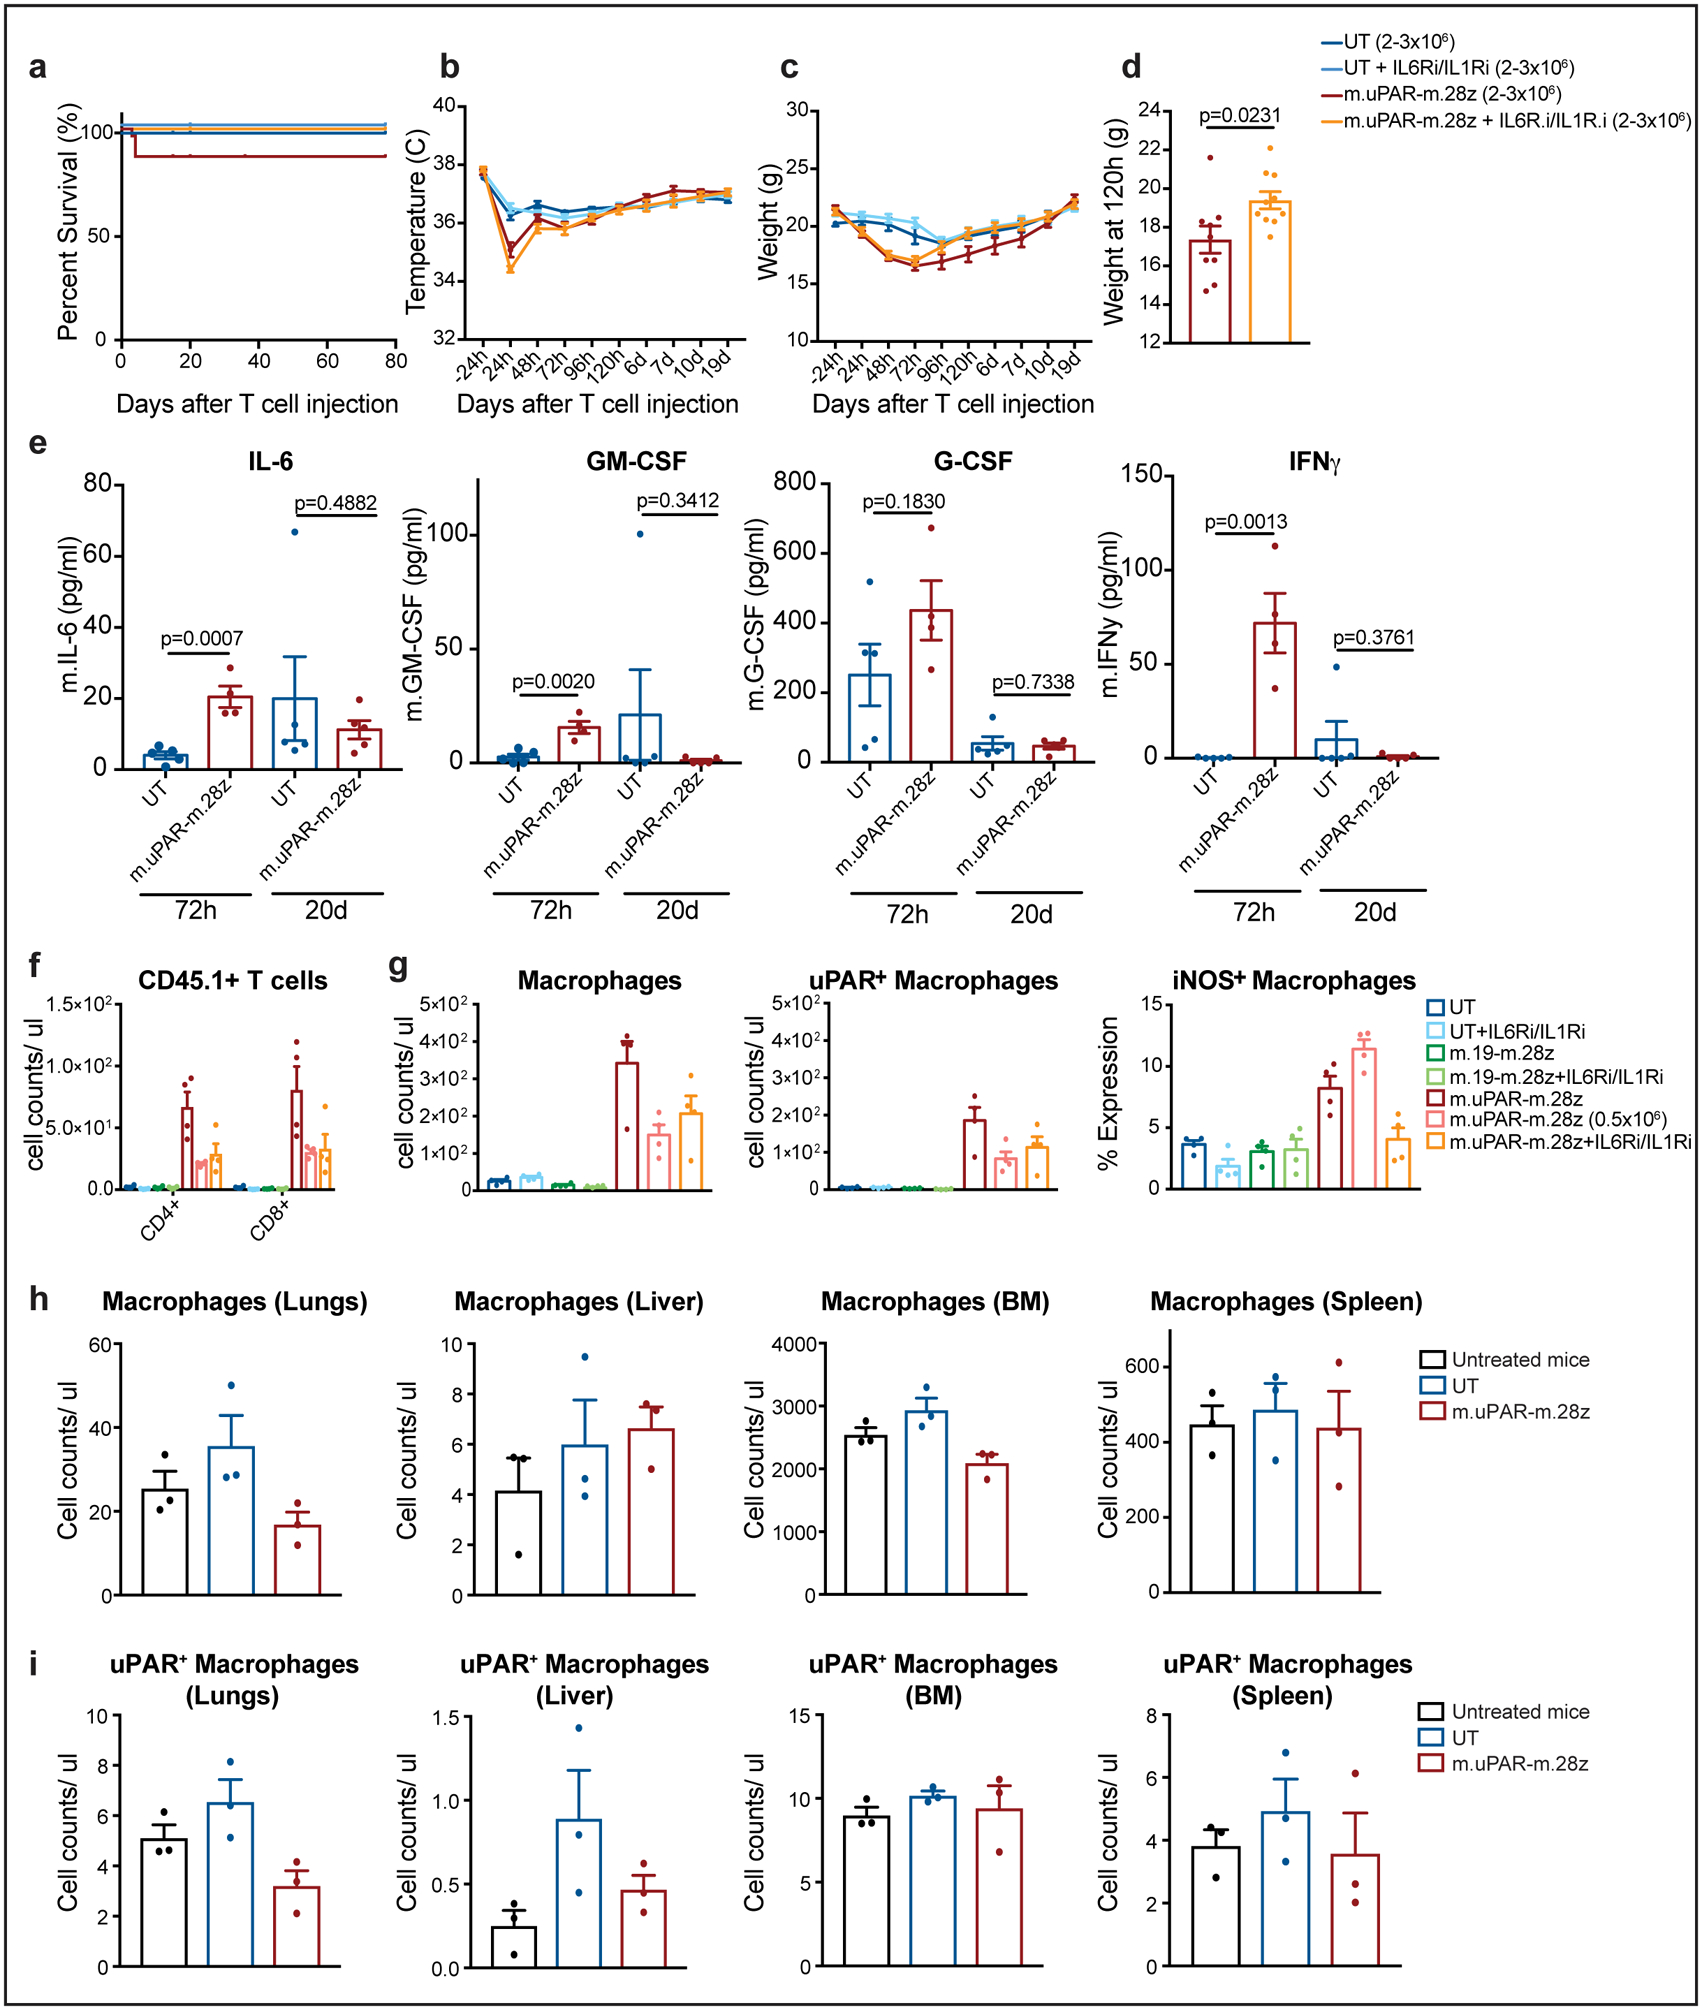
C57BL/6N mice received semiweekly intraperitoneal (ip) infusions of CCl4 for 6 weeks followed by intravenous (iv) infusion of 2–3×10⁶ murine m.uPAR-m.28z CAR T cells or untransduced (UT) T cells 16–24hr after cyclophosphamide (200mg/kg) administration. A subset of mice (as specified in the figures) received additional treatment with IL6R blocking antibodies (IL6Ri) and Anakinra (IL1Ri), starting 24h before T cell infusion and continued daily until 6 days after T cell infusion. Mice were euthanized 12 weeks after CAR infusion to assess potential toxicities. (a) Kaplan-Meier curve showing survival of mice after CAR T cell injection (UT: n=19 mice, UT + IL6Ri/IL1Ri: n=7, m.uPAR-m.28z: n=30, m.uPAR-m.28z + IL6Ri/IL1Ri: n=19). (b-c) Temperature (b) and weight (c) of treated mice (UT: n=7 mice, UT + IL6Ri/IL1Ri: n=8, m.uPAR-m.28z: n=11, m.uPAR-m.28z + IL6Ri/IL1Ri: n=10). (d) Weight (g) of mice 120h after infusion with either m.uPAR-m.28z or m.uPAR-m.28z and additional treatment with IL6Ri and IL1Ri (m.uPAR-m.28z: n=11, m.uPAR-m.28z + IL6Ri/IL1Ri: n=10). (e) Serum levels of murine IL-6, GM-CSF, G-CSF and IFNy in mice treated with either m.uPAR-m.28z or UT T cells 72h or 20 days after T cell infusion (UT: n=5, m.uPAR-m.28z: n=4 at 72h and n=5 at 20d). (f-g) Number of adoptively transferred CD45.1 positive T cells (f), macrophages, uPAR-positive and iNOS-positive macrophages (g) in the lungs of mice treated with m.uPAR-m.28z, m.19-m.28z or UT T cells alone or in combination with combined IL6Ri and ILR1i 3 days after T cell infusion (n=4 mice per group). (h-i) Numbers of macrophages (h) and uPAR positive macrophages (i) in lungs, liver, bone marrow (BM) and spleen of untreated mice or mice treated with either m.uPAR-m.28z or UT T cells 12 weeks after T cell infusion (n=3 mice per group). (a-e) Representative results of 3 independent experiments. All data represent mean± SEM. Two-tailed unpaired Student’s t-test. (f-i) Representative results of 1 independent experiment. All data represent mean± SEM. Two-tailed unpaired Student’s t-test.