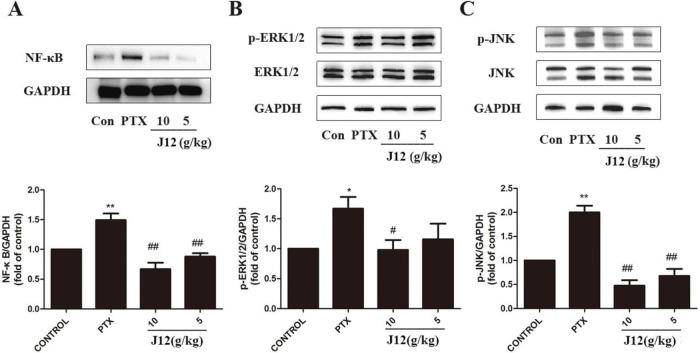
Fig. 2.
(A) NF-κB was increased in the mice from PTX group and J12 inhibited the activations. (B) p-ERK1/2 was increased in the mice from PTX group and J12 inhibited the activations. (C) p-JNK was increased in the mice from PTX group and J12 inhibited the activations. n = 5 in each group. * vs Control, p < 0.05; **vs Control, p < 0.01; # vs PTX, p < 0.05. Data are expressed as mean ± SEM.

