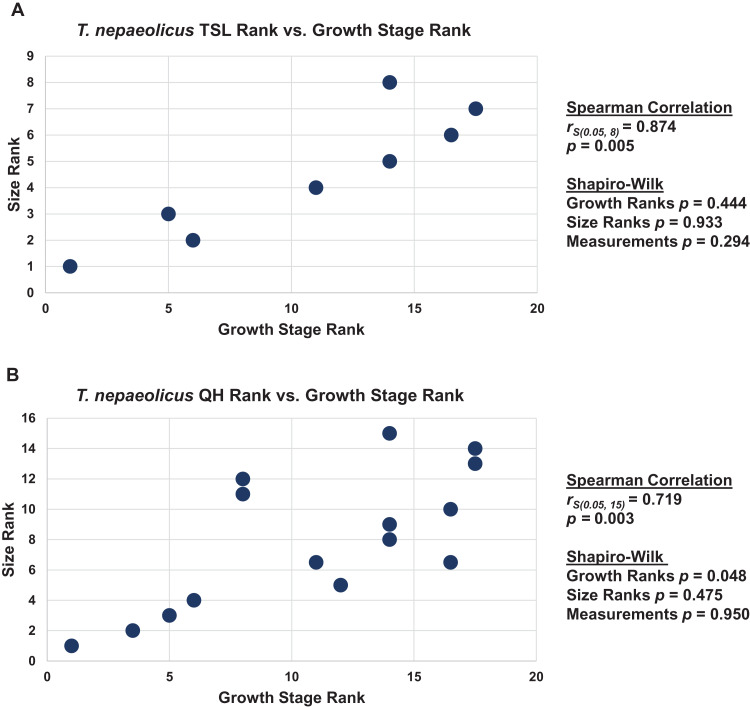
Figure 18. Size and maturity are positively correlated in Tylosaurus nepaeolicus.
(A) Scatterplot and statistics for TSL data. (B) Scatterplot and statistics for QH data. The growth stages and size data for TSL and QH of each T. nepaeolicus (pink), T. kansasensis (yellow), and Tylosaurus sp. (black) specimen included in the growth series (for which measurements were available) were converted into ranks and plotted. Congruence between size rank and growth stage rank was tested with Spearman rank-order correlation. Both TSL and QH have a significant positive correlation with growth stage in this taxon. Shapiro–Wilk tests determined that TSL (but not QH) growth rank, size rank, and raw measurement data are normally distributed.

