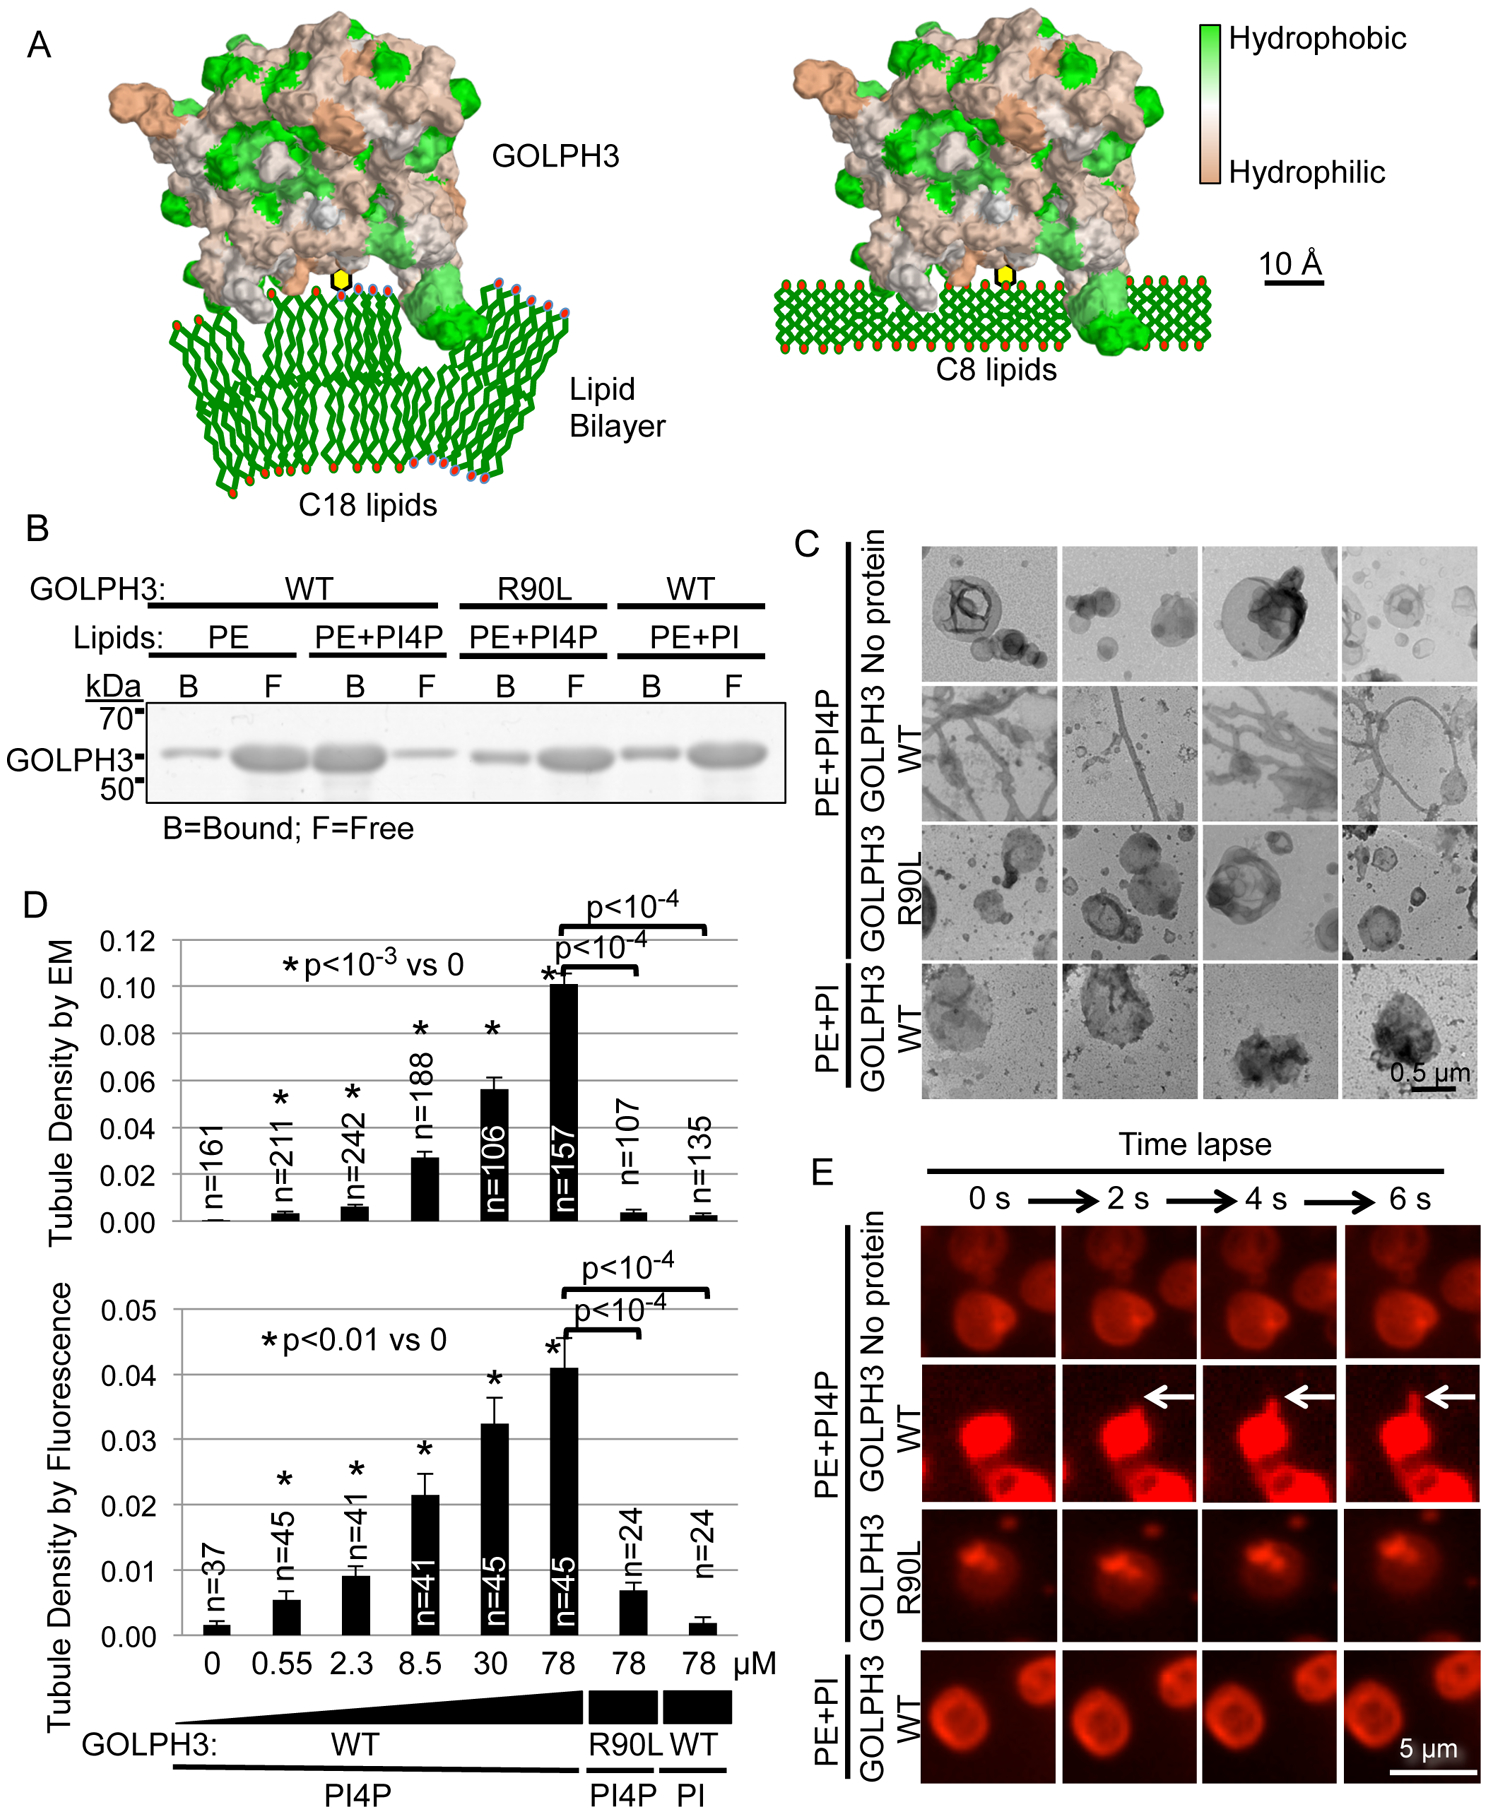
Figure 1. GOLPH3 Binding to PI4P Causes Liposomal Tubulation.

(A) Model of GOLPH3 (hydrophobicity/hydrophilicity surface map from PDB 3KN1) binding to PI4P in natural liposomes (C18 and higher) causing membrane curvature (left), whereas binding to short-chain (C8) liposomes does not (right; see also Figure 3).
(B) Liposomes that contain 1.8 mol% PI4P, PI, or no phosphoinositide were incubated with 14 μM bacterially expressed GST-GOLPH3 (WT or the R90L mutant that does not bind PI4P). Liposome-bound and free protein were separated by ultracentrifugation and detected by SDS-PAGE/Coomassie Brilliant Blue.
(C) Aliquots of the binding reactions from (B) were examined by EM. Four representative images are included for each condition. See also Figures S1A–D for comparison to the EPSIN ENTH domain and examples of vesicles containing PS or PC.
(D) Quantification of (C) and (E), measuring tubulation in response to increasing concentrations of GOLPH3 (WT or the R90L mutant). Graphs indicate mean ± SEM of tubule density observed by EM (upper graph) or by fluorescence imaging (lower graph). The number (n) of randomly selected fields imaged is indicated, pooled from four (EM) or four (fluorescence) independent experiments. p values are indicated, calculated by t test.
(E) Nile Red-labeled liposomes containing 1.8 mol% PI4P, PI, or no phosphoinositide were examined by confocal fluorescence time-lapse imaging (2 seconds per frame) upon addition of the indicated proteins (at 14 μM). See also Movie S1.
