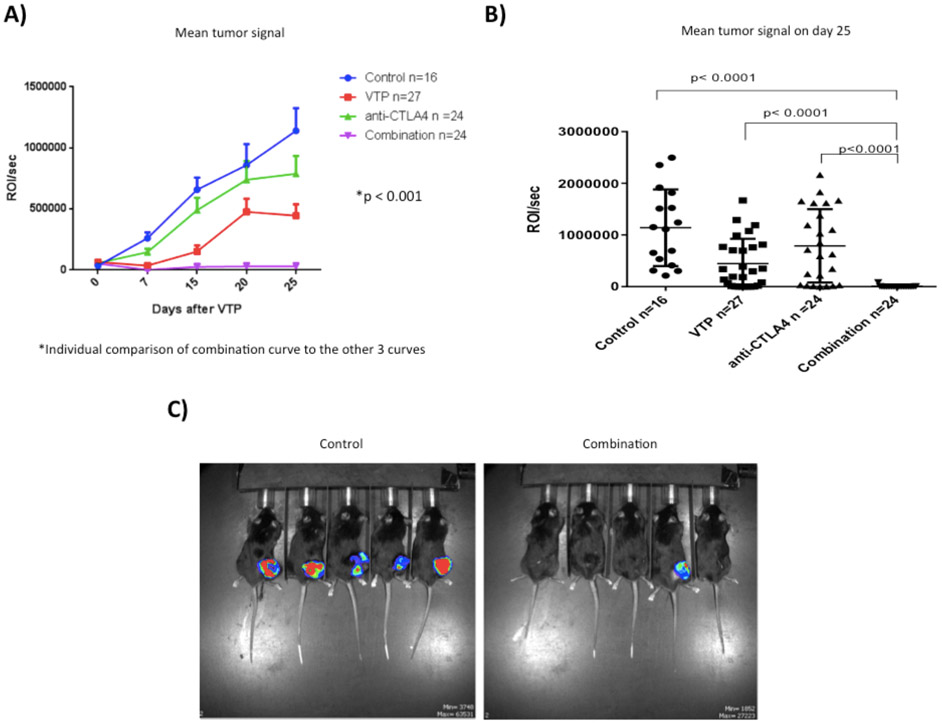
Figure 2 –
Effect of different therapies on primary tumor. A) Mean primary tumor growth curves. B) Mean and individual tumor signal on Day 37 (25 days post WST11-VTP). The combination of WST11-VTP + anti-CTLA-4 was significantly associated with a decreased primary tumor signal. C) Pictures of primary tumor imaging with bioluminescent imaging on the 25th day after treatment with WST11-VTP. The picture on the right shows 5 mice from the combination treatment group and the picture on the left is from the control group. Among the 5 mice from each group, tumors were palpable in 1 mouse from the combination group and all 5 mice from the control group.

