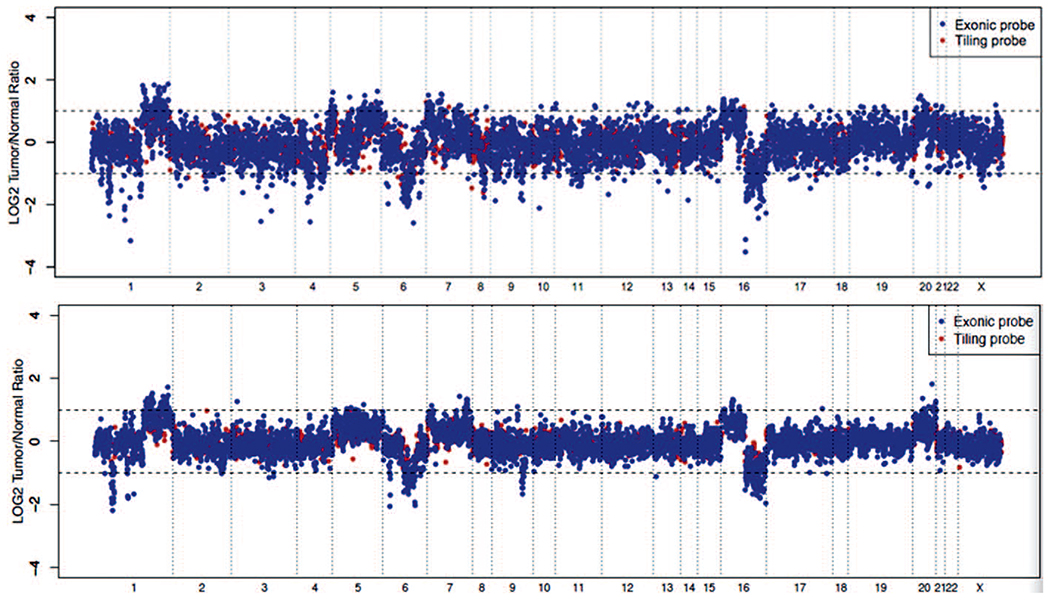
Figure 4.

Representative copy number plots of a cell pellet sample. Log ratios comparing tumor versus normal sequencing coverage values are calculated across all targeted regions on different chromosomes. The top panel shows the results when a standard formalin-fixed, paraffin-embedded normal is used as a control; the bottom is normalized using a cytology normal that was processed and extracted using the same protocol as the clinical sample. The bottom panel shows a sharper copy number profile, allowing a more accurate assessment of copy number changes across the genome.
