
Figure 2. Optimized Performance of the HL-Chip for Trapping Bead-Cell Pairs, Cell-Cell Pairs, and Cell-Cell-Bead Pairs.
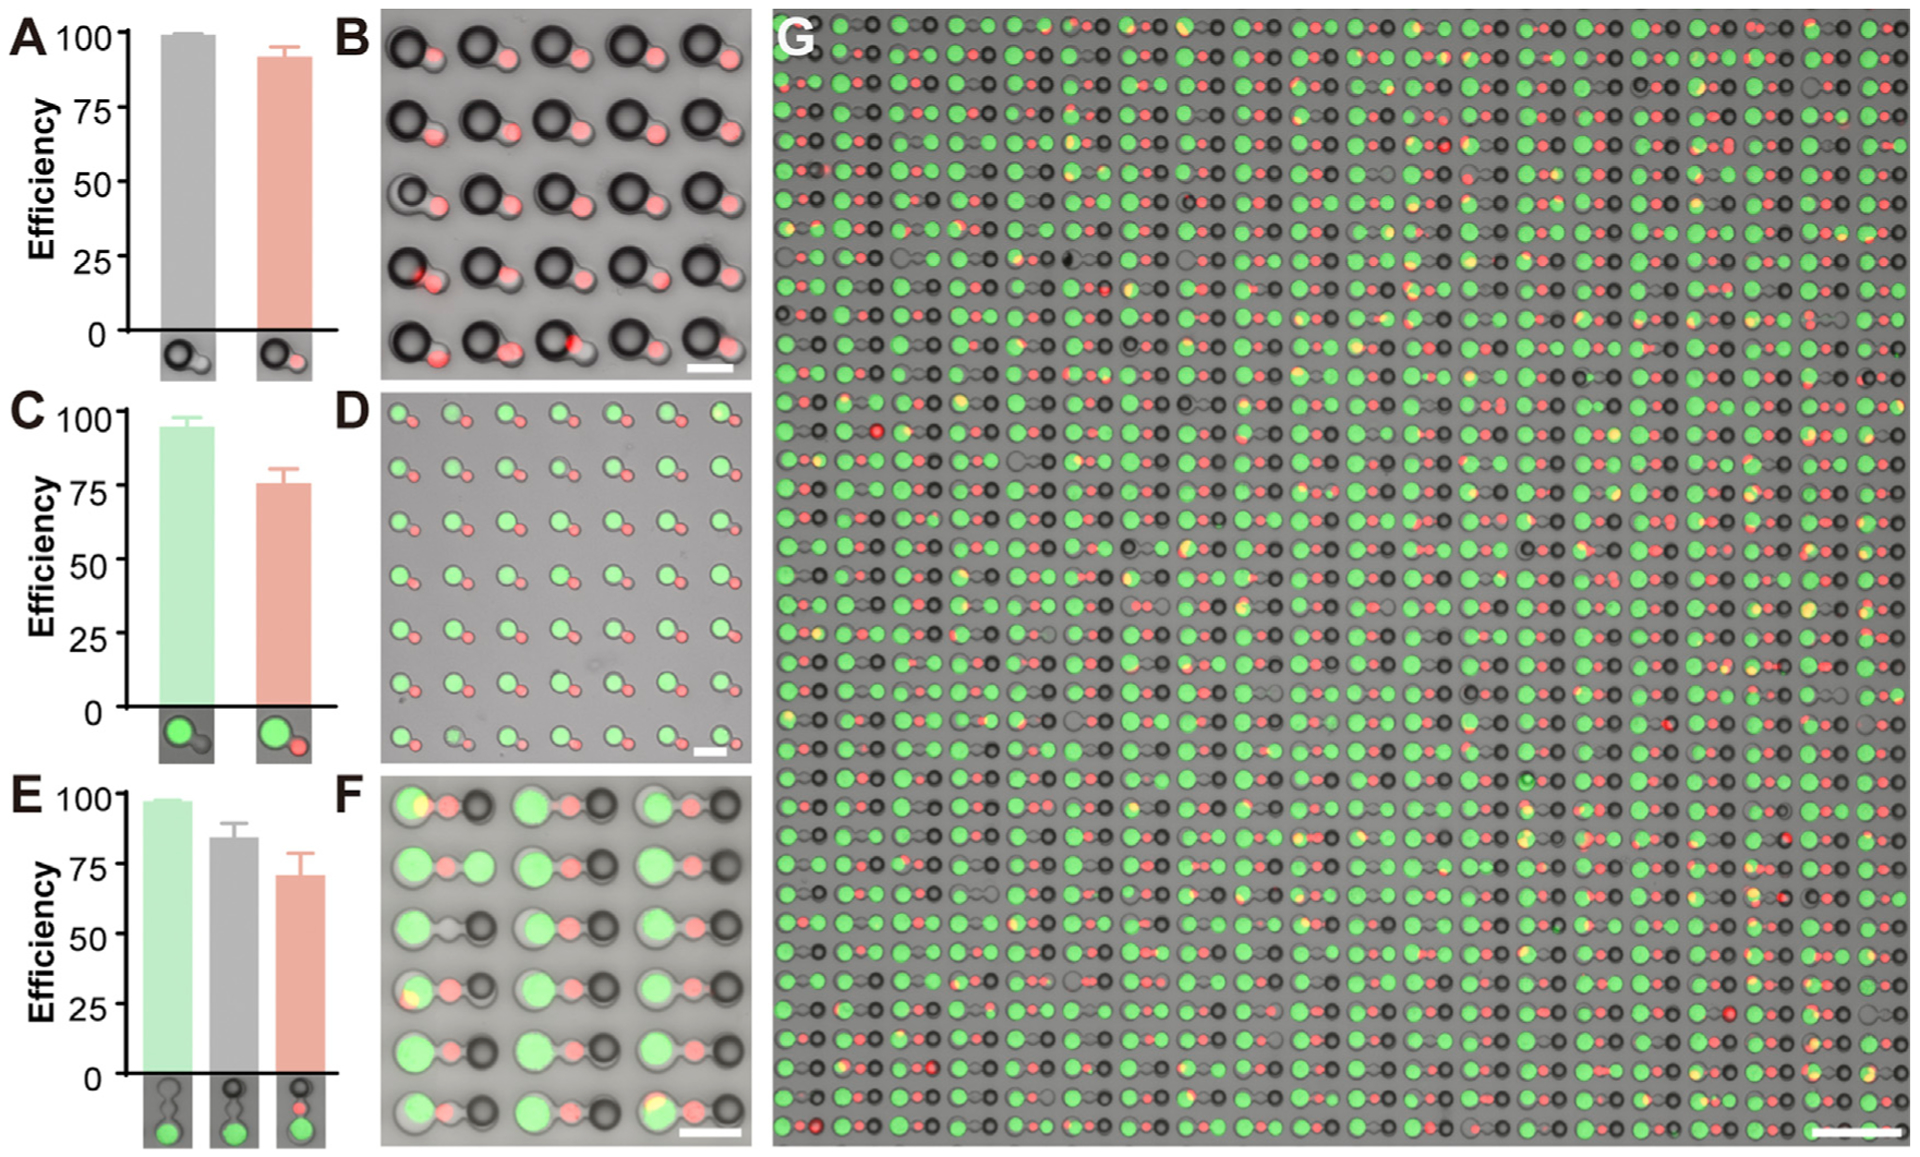
(A and B) Loading efficiency (A) and representative (B) bright-field image overlaid with fluorescent image of bead-cell (red) pairing.
(C and D) Loading efficiency (C) and representative (D) overlaid image of cell-cell pairing.
(E) Loading efficiency and (F) representative overlaid image of cell-cell-bead pairing.
(G) A representative overlaid image depicting cell-cell-bead pairing. Loading and pairing efficiency (Well occupied/Well total) was calculated from three randomly selected microscopic fields (>400 well units) from at least three independent loading experiments.
Scale bars for (B), (D), and (F) are 30 mm and for (G) 100 μm.
See also Figures S1 and S2.