
Figure 4. Single-Cell On-Chip Cytotoxicity Assay Using Dual-Well HL-Chips.
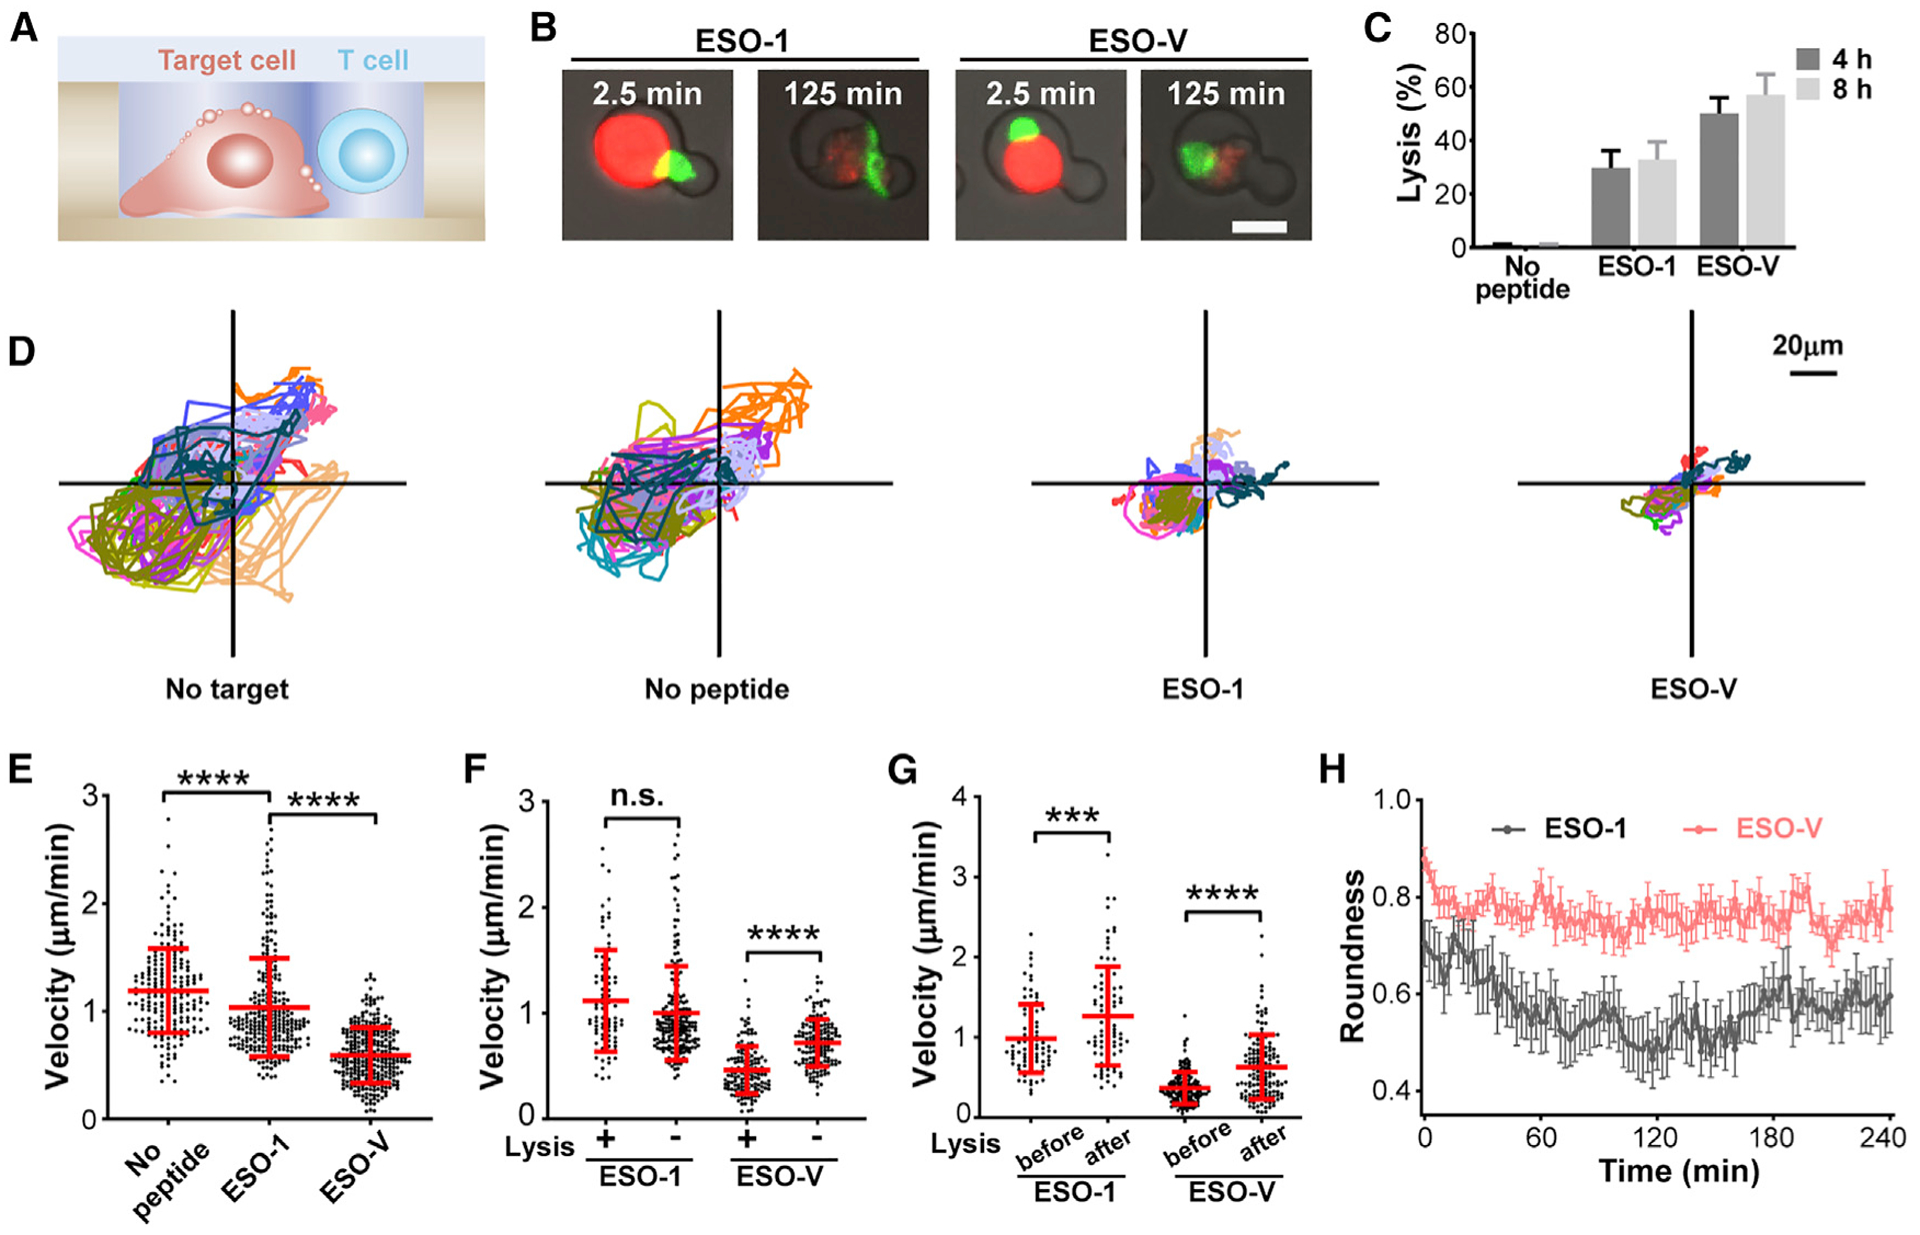
(A and B) Illustration (A) and microscopic images (B) of the cytotoxicity mediated by NY-ESO-1 TCR-T cells against peptide-pulsed PC3/HLA-A2 cells. Scale bar, 20 μm.
(C) Lysis rates of single NY-ESO-1 TCR-T cells paired with single target cells without pulsing or pulsed with the NY-ESO-1157–165 peptide or the NY-ESO-V157–165 peptide for 4 or 8 h. Results are from n = 4 independent experiments. (D) Tracks of NY-ESO-1 TCR-T cells in the absence of target cells, paired with target cells without pulsing or pulsed with indicated peptides. Each plot displays n = 15 randomly selected tracks.
(E) Mean velocities of NY-ESO-1 TCR-T cells in microwells paired with target cells without pulsing (n = 211) or pulsed with the NY-ESO-1157–165 peptide (n = 282) or the NY-ESO-V157–165 peptide (n = 285).
(F) Mean velocities of lytic and non-lytic NY-ESO-1 TCR-T cells paired with target cells pulsed with indicated peptides.
(G) Mean velocities of NY-ESO-1 T cells before and after lysis of target cells pulsed with indicated peptides. Data represent mean ± SD. Each data point represents mean velocity for one cell from n = 4 independent experiments for (E)–(G). **p < 0.01, ***p < 0.001, ****p < 0.0001, by two-tailed Student’s t test.(H) Roundness of 20 randomly selected NY-ESO-1 T cells paired with target cells pulsed with indicated peptides. Data represent mean ± SEM.