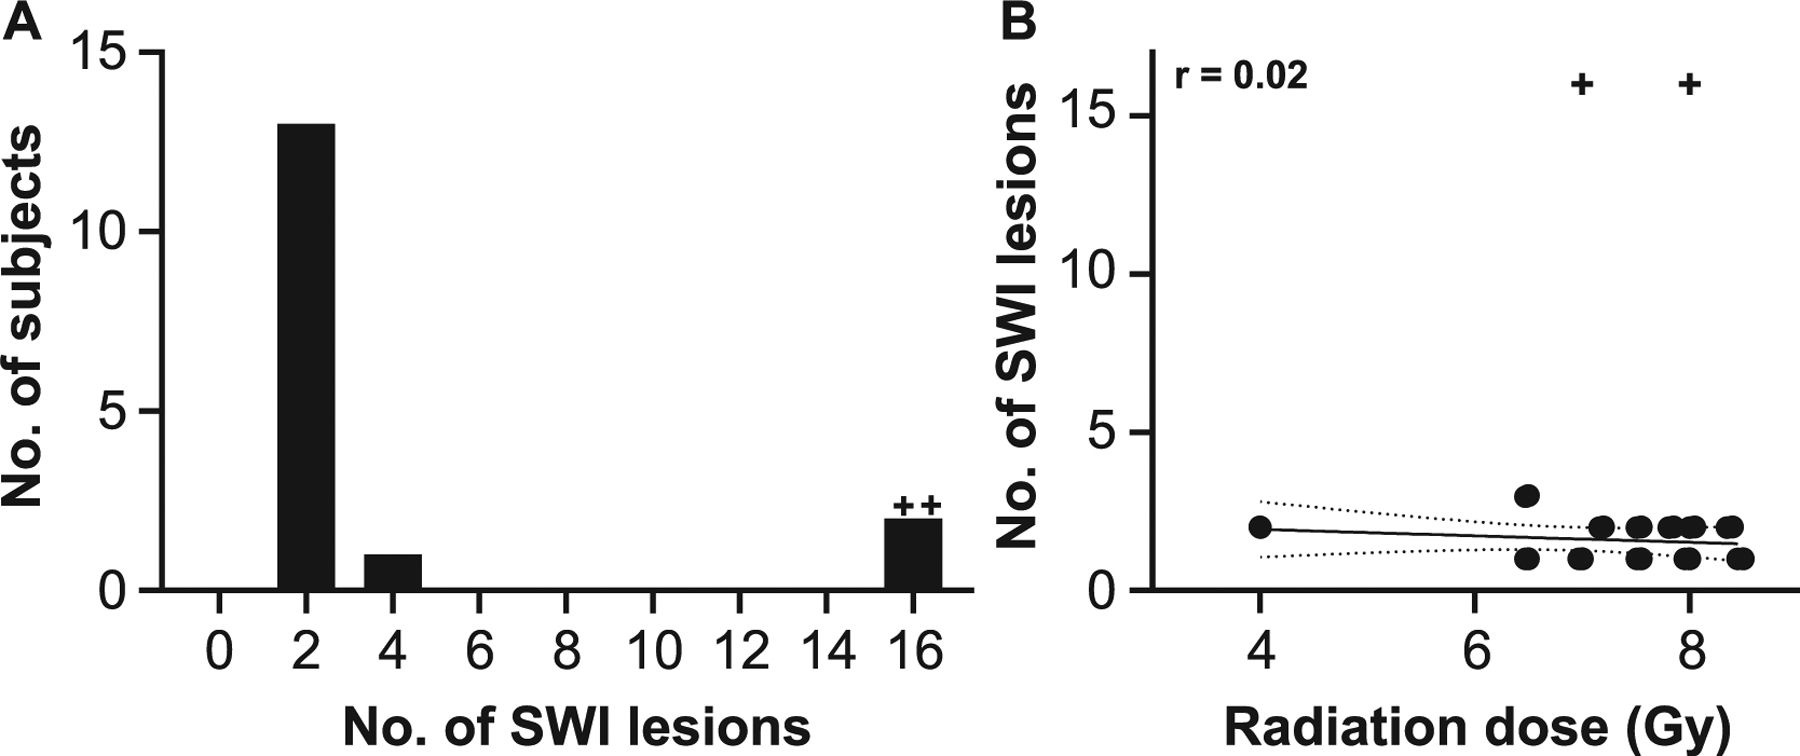
FIG. 4.

Evaluation of radiation-dose response on SWI-MRI lesion number. Panel A: Most animals had 1–2 SWI hypointense foci. Frequency histogram. Panel B: There was no statistically significant relationship between radiation dose and lesion number. Linear regression analysis, r = 0.2, P > 0.05. Solid line indicates best fit; slope = −0.1. Dotted lines indicate 95% confidence interval. +Outlier, as determined by ROUT method and excluded from regression analysis.
