
Figure 3. MUA as a function of bioluminescence.
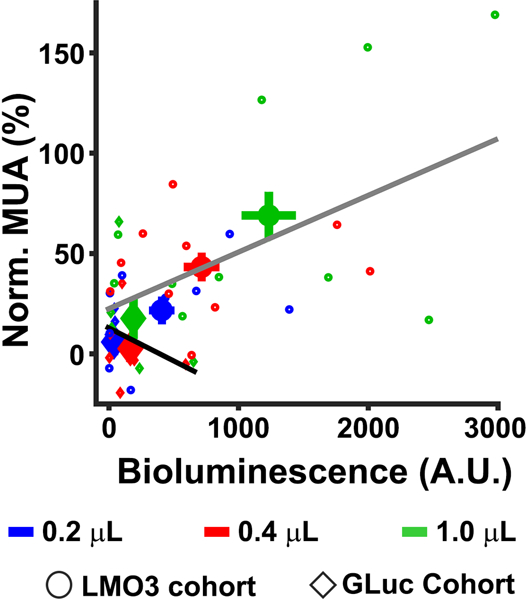
The relationship is shown between averaged bioluminescence and MUA for each CTZ dose condition in the LMO3 (circle symbol) and GLuc (diamond symbol) cohorts for the time period (0 – 400 seconds after injection of CTZ). The larger symbols indicate the mean activity for each CTZ dose condition.