
Figure 5. 64Cu-Macrin PET detects lung macrophage dynamics after MI.
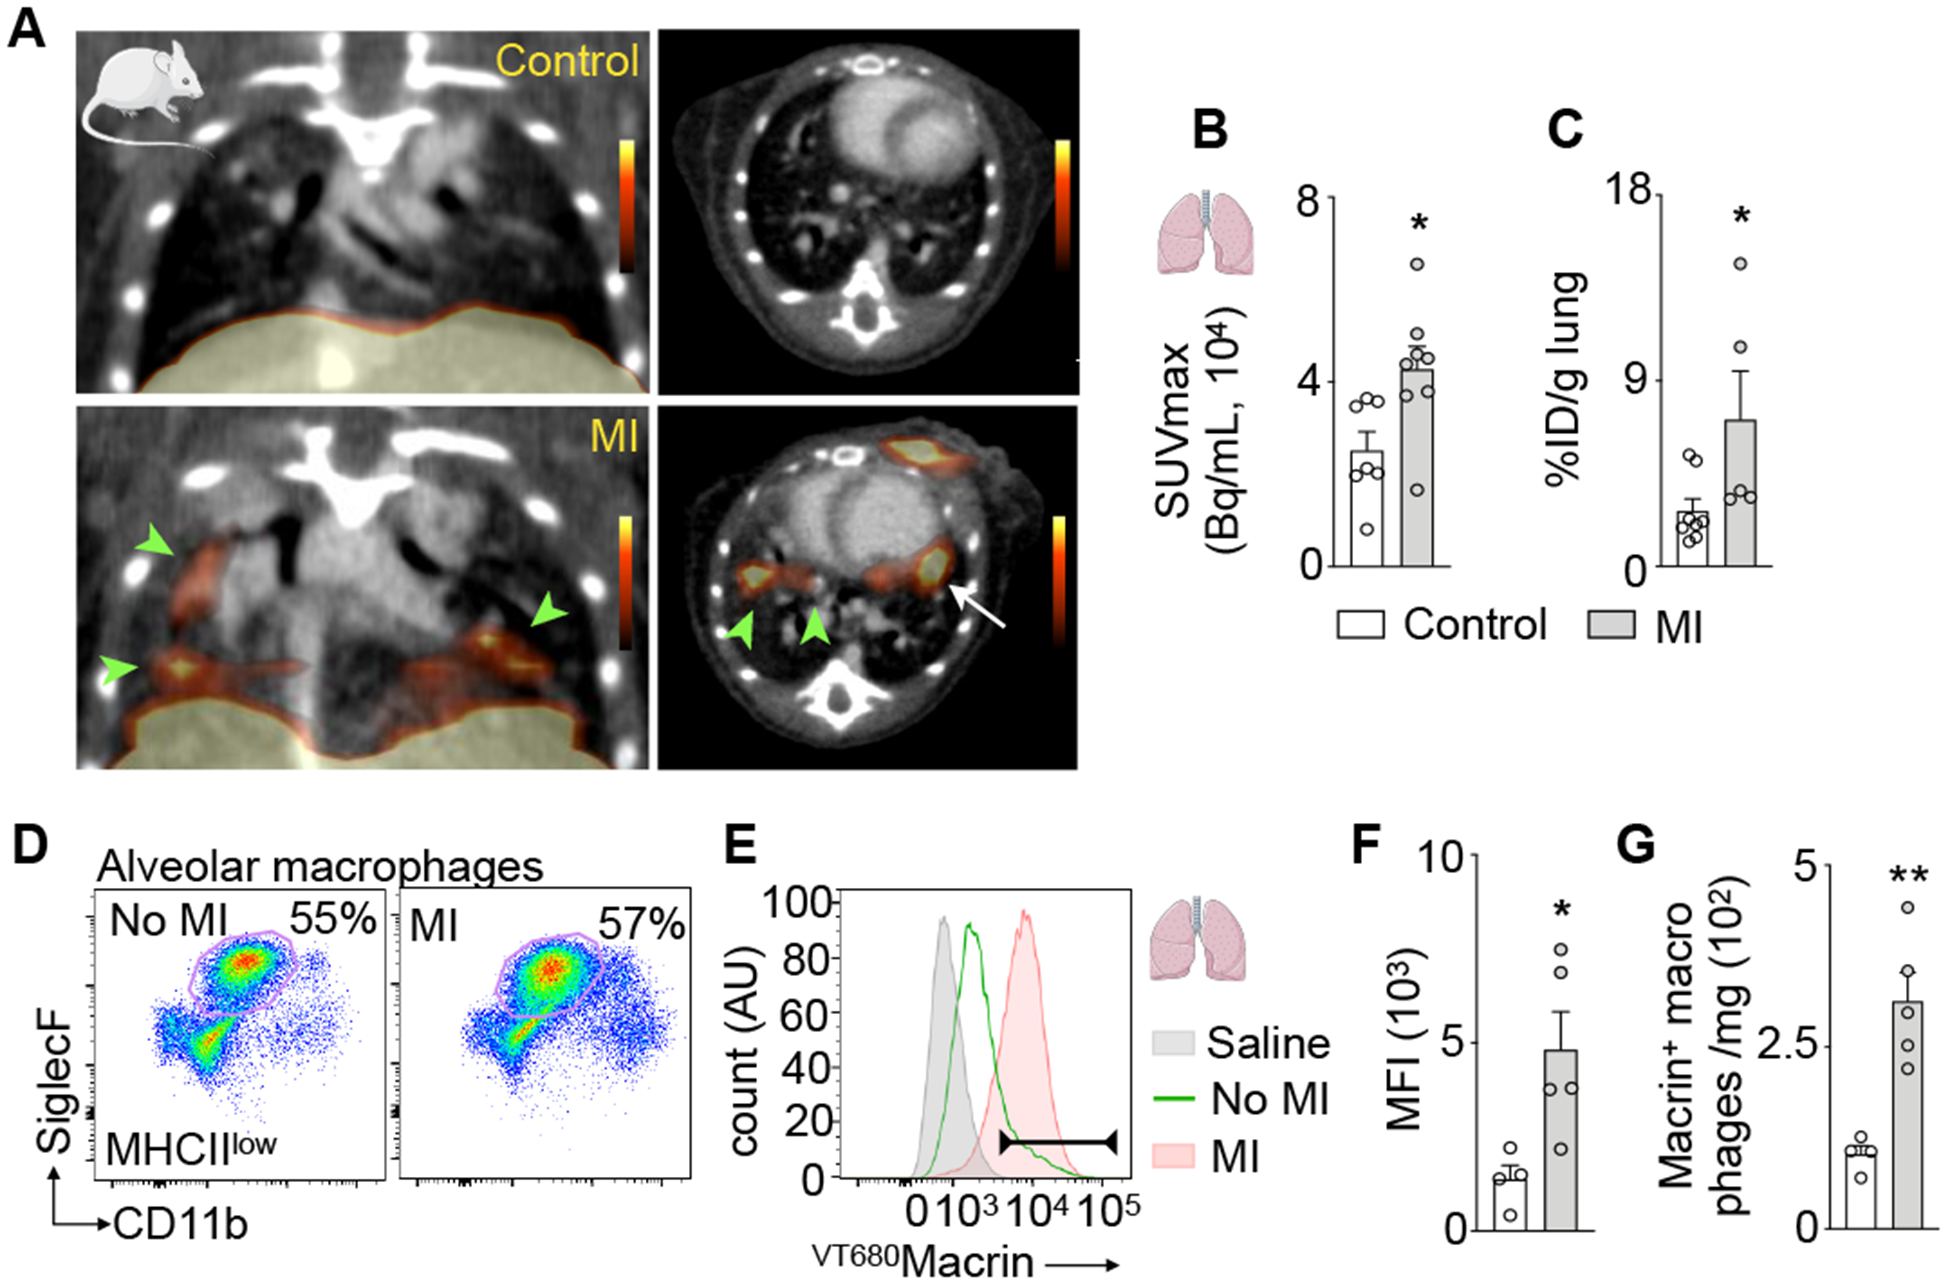
(A) Coronal and axial PET/CT images from control mouse (top) and mouse on day 5 after MI (bottom). Areas with high uptake in lung are indicated with arrowheads. Arrow indicates MI. (B) 64Cu-Macrin signal in lung quantified by PET and (C) ex vivo scintillation counting. (D) Flow plots of alveolar macrophages in controls and mice after MI. (E) VT680Macrin fluorescence of alveolar macrophages; saline-injected controls (shaded grey), VT680Macrin injected control mice (solid green) and MI (shaded orange). (F) VT680Macrin mean fluorescence intensity (MFI) in alveolar macrophages. (G) Number of Macrin+ alveolar macrophages. Data are mean ± SEM. *P<0.05, **P<0.01, ***P<0.001.