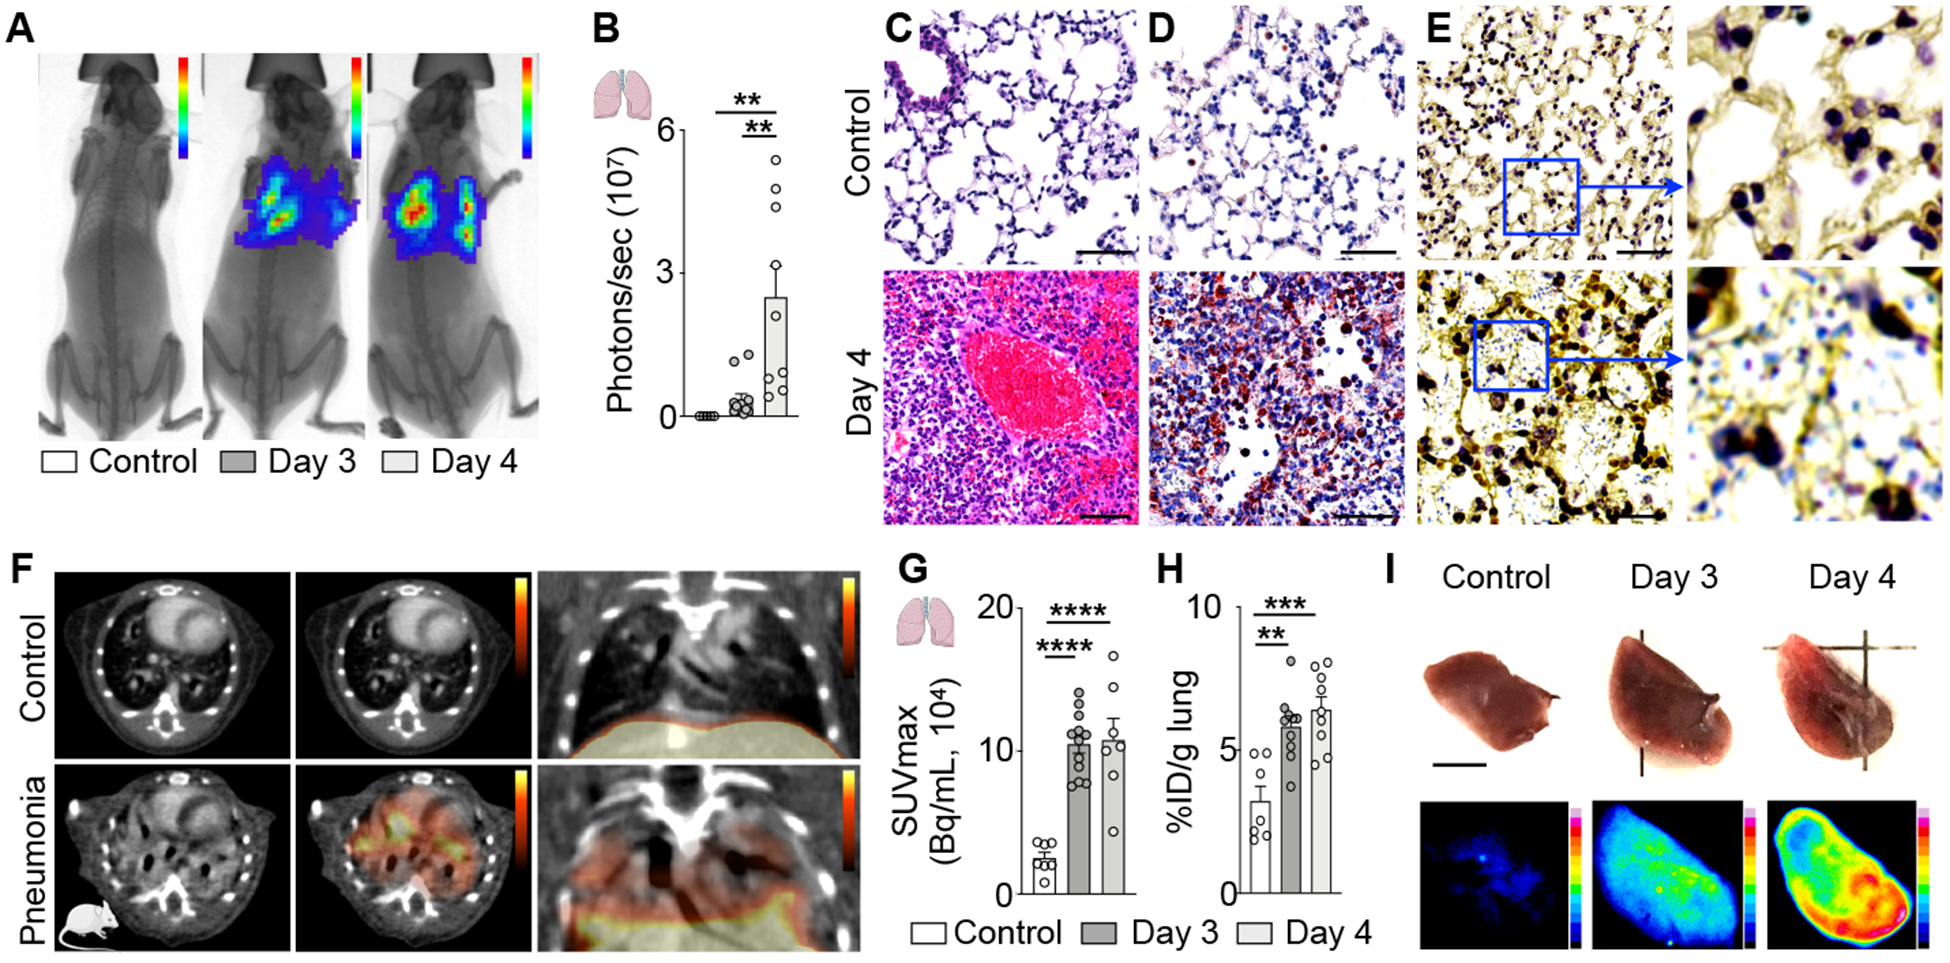
Figure 7. 64Cu-Macrin PET imaging detects lung inflammation in mice.

(A) Bioluminescent / X-ray images of control mouse (left) and mice with pneumonia on days 3 and 4 after inoculation with bioluminescent Streptococcus pneumoniae. (B) Bacterial burden assessed by bioluminescence. (C-E) Lung histology from uninfected controls (top) and mice with pneumonia (bottom, day 4; scale bar, 50 μm), (C) H&E, (D) IHC for mouse macrophages (brown) and (E) gram-staining for streptococcus pneumoniae (pale blue). (F) PET/CT images from control mouse (top) and mouse with pneumonia (bottom, day 4 after infection). (G) 64Cu-Macrin lung uptake by in vivo PET and (H) ex vivo scintillation counting. (I) Visualization of 64Cu-Macrin accumulation in mouse lungs by autoradiography (scale bar, 5 mm). Data are mean ± SEM. *P<0.05, **P<0.01, ***P<0.001, ****P<0.0001.
